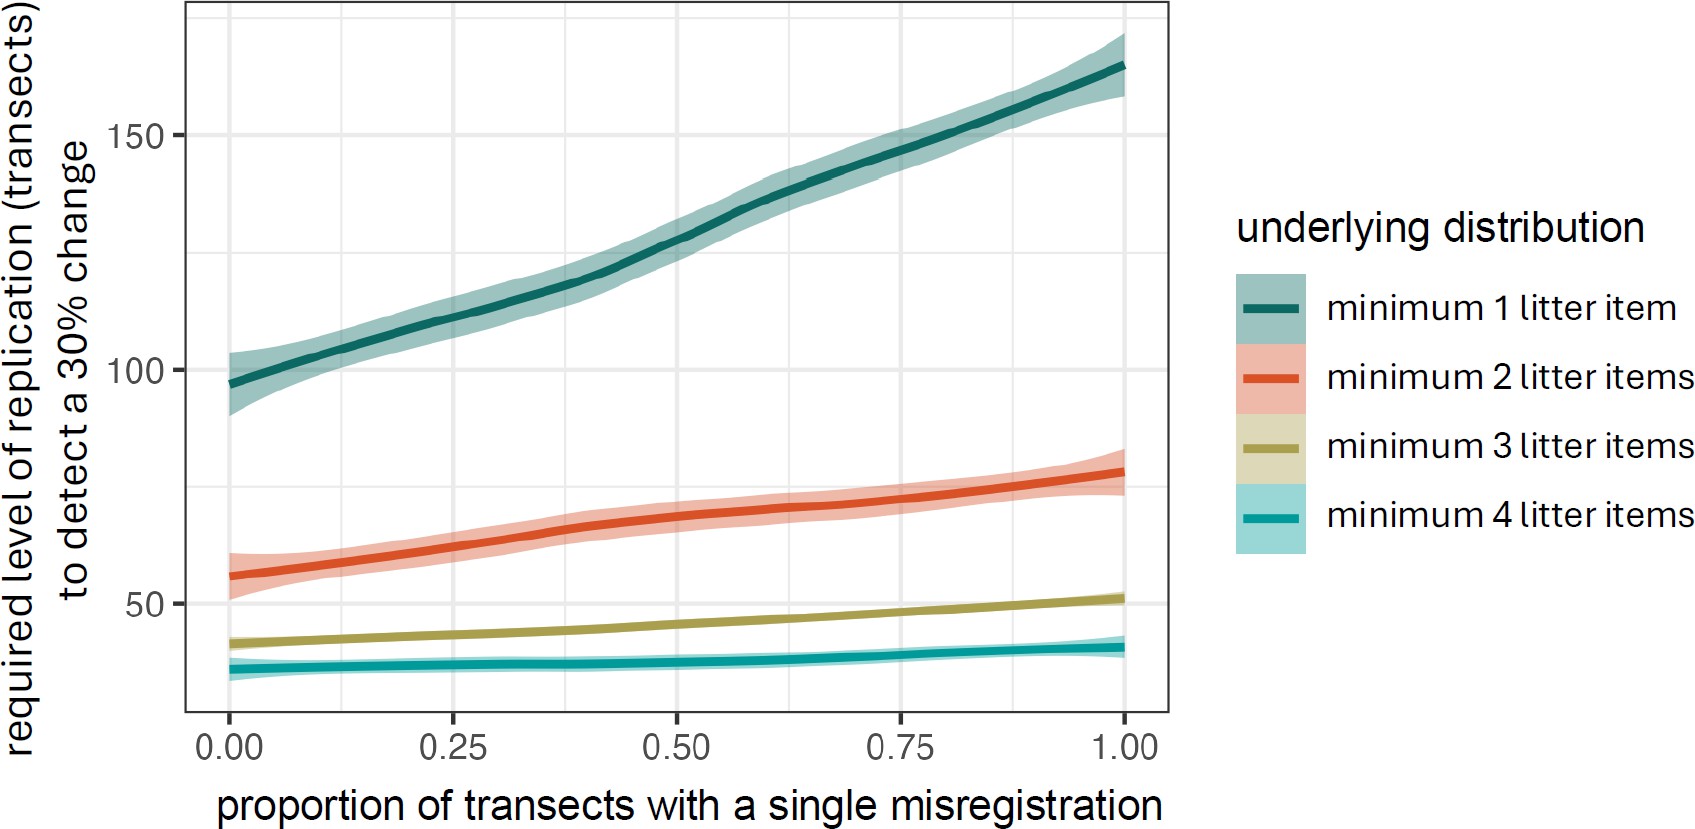
Figure 28. Required replication level to achieve 80% power to measure a 30% change simulated for different threshold values to include a location (different distributions used as a basis) and at different proportions of the transects with an error registration if the transects do not overlap exactly between years. In this case, a simulated error registration was randomly selected as +1 or -1 object. Note that if the probability of one is significantly higher than the other, this could lead to systematic misinterpretations regarding trends in litter supply and density, and not just increased uncertainty as shown here. For the distributions used as a basis, the parameters for the negative binomial distributions are adjusted to the raw data (all transects from MAREANO 2006-2023 that had a number of litter items equal to or higher than the threshold values 1, 2, 3 or 4.