Figure
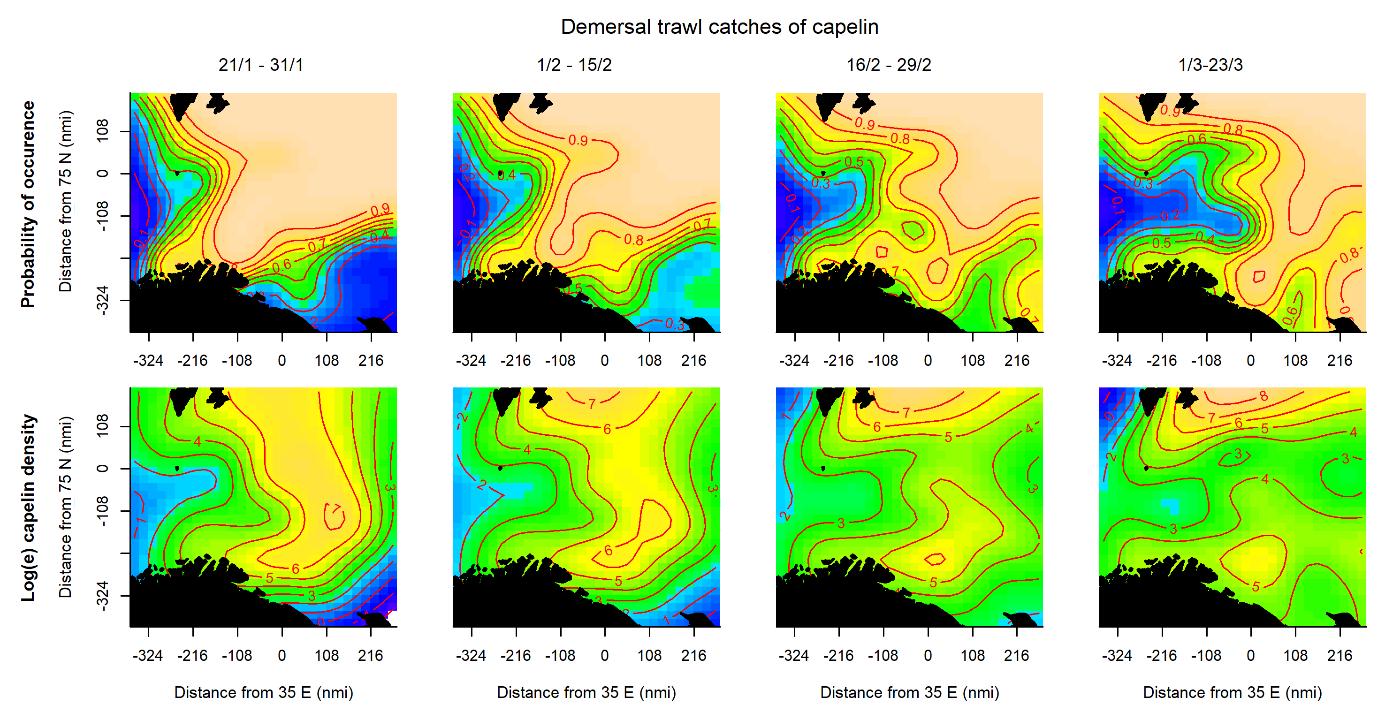
3.2: Capelin distribution modelled with demersal trawl data.
Predicted probability of capelin occurrence (top panel) and capelin
density (bottom panel) in period 1-4. To generate these figures, the
non-spatial predictor (sun height) was kept at mean value for each
location.