Gå til hovedinnhold
Havforskningsinstituttet
HI
English
<- Tilbake
Søk
Søk
Søk
View page in English
Figur
Fra rapporten:
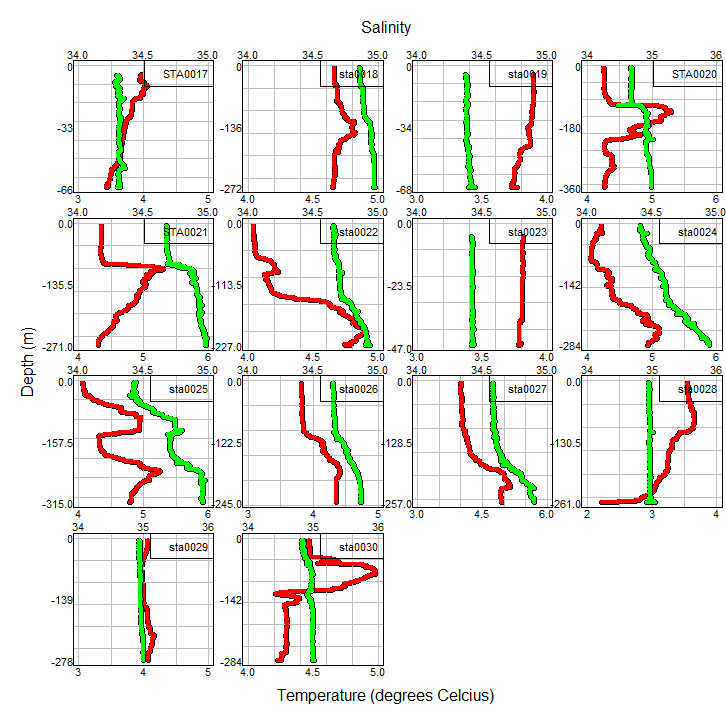
Testing of trawl-acoustic stock estimation of spawning capelin 2022
Fig. 10b) Temperature (red) and salinity (green) profiles for the eastern coverage area. The stations referred to are shown in the lower panel of Fig. 2.