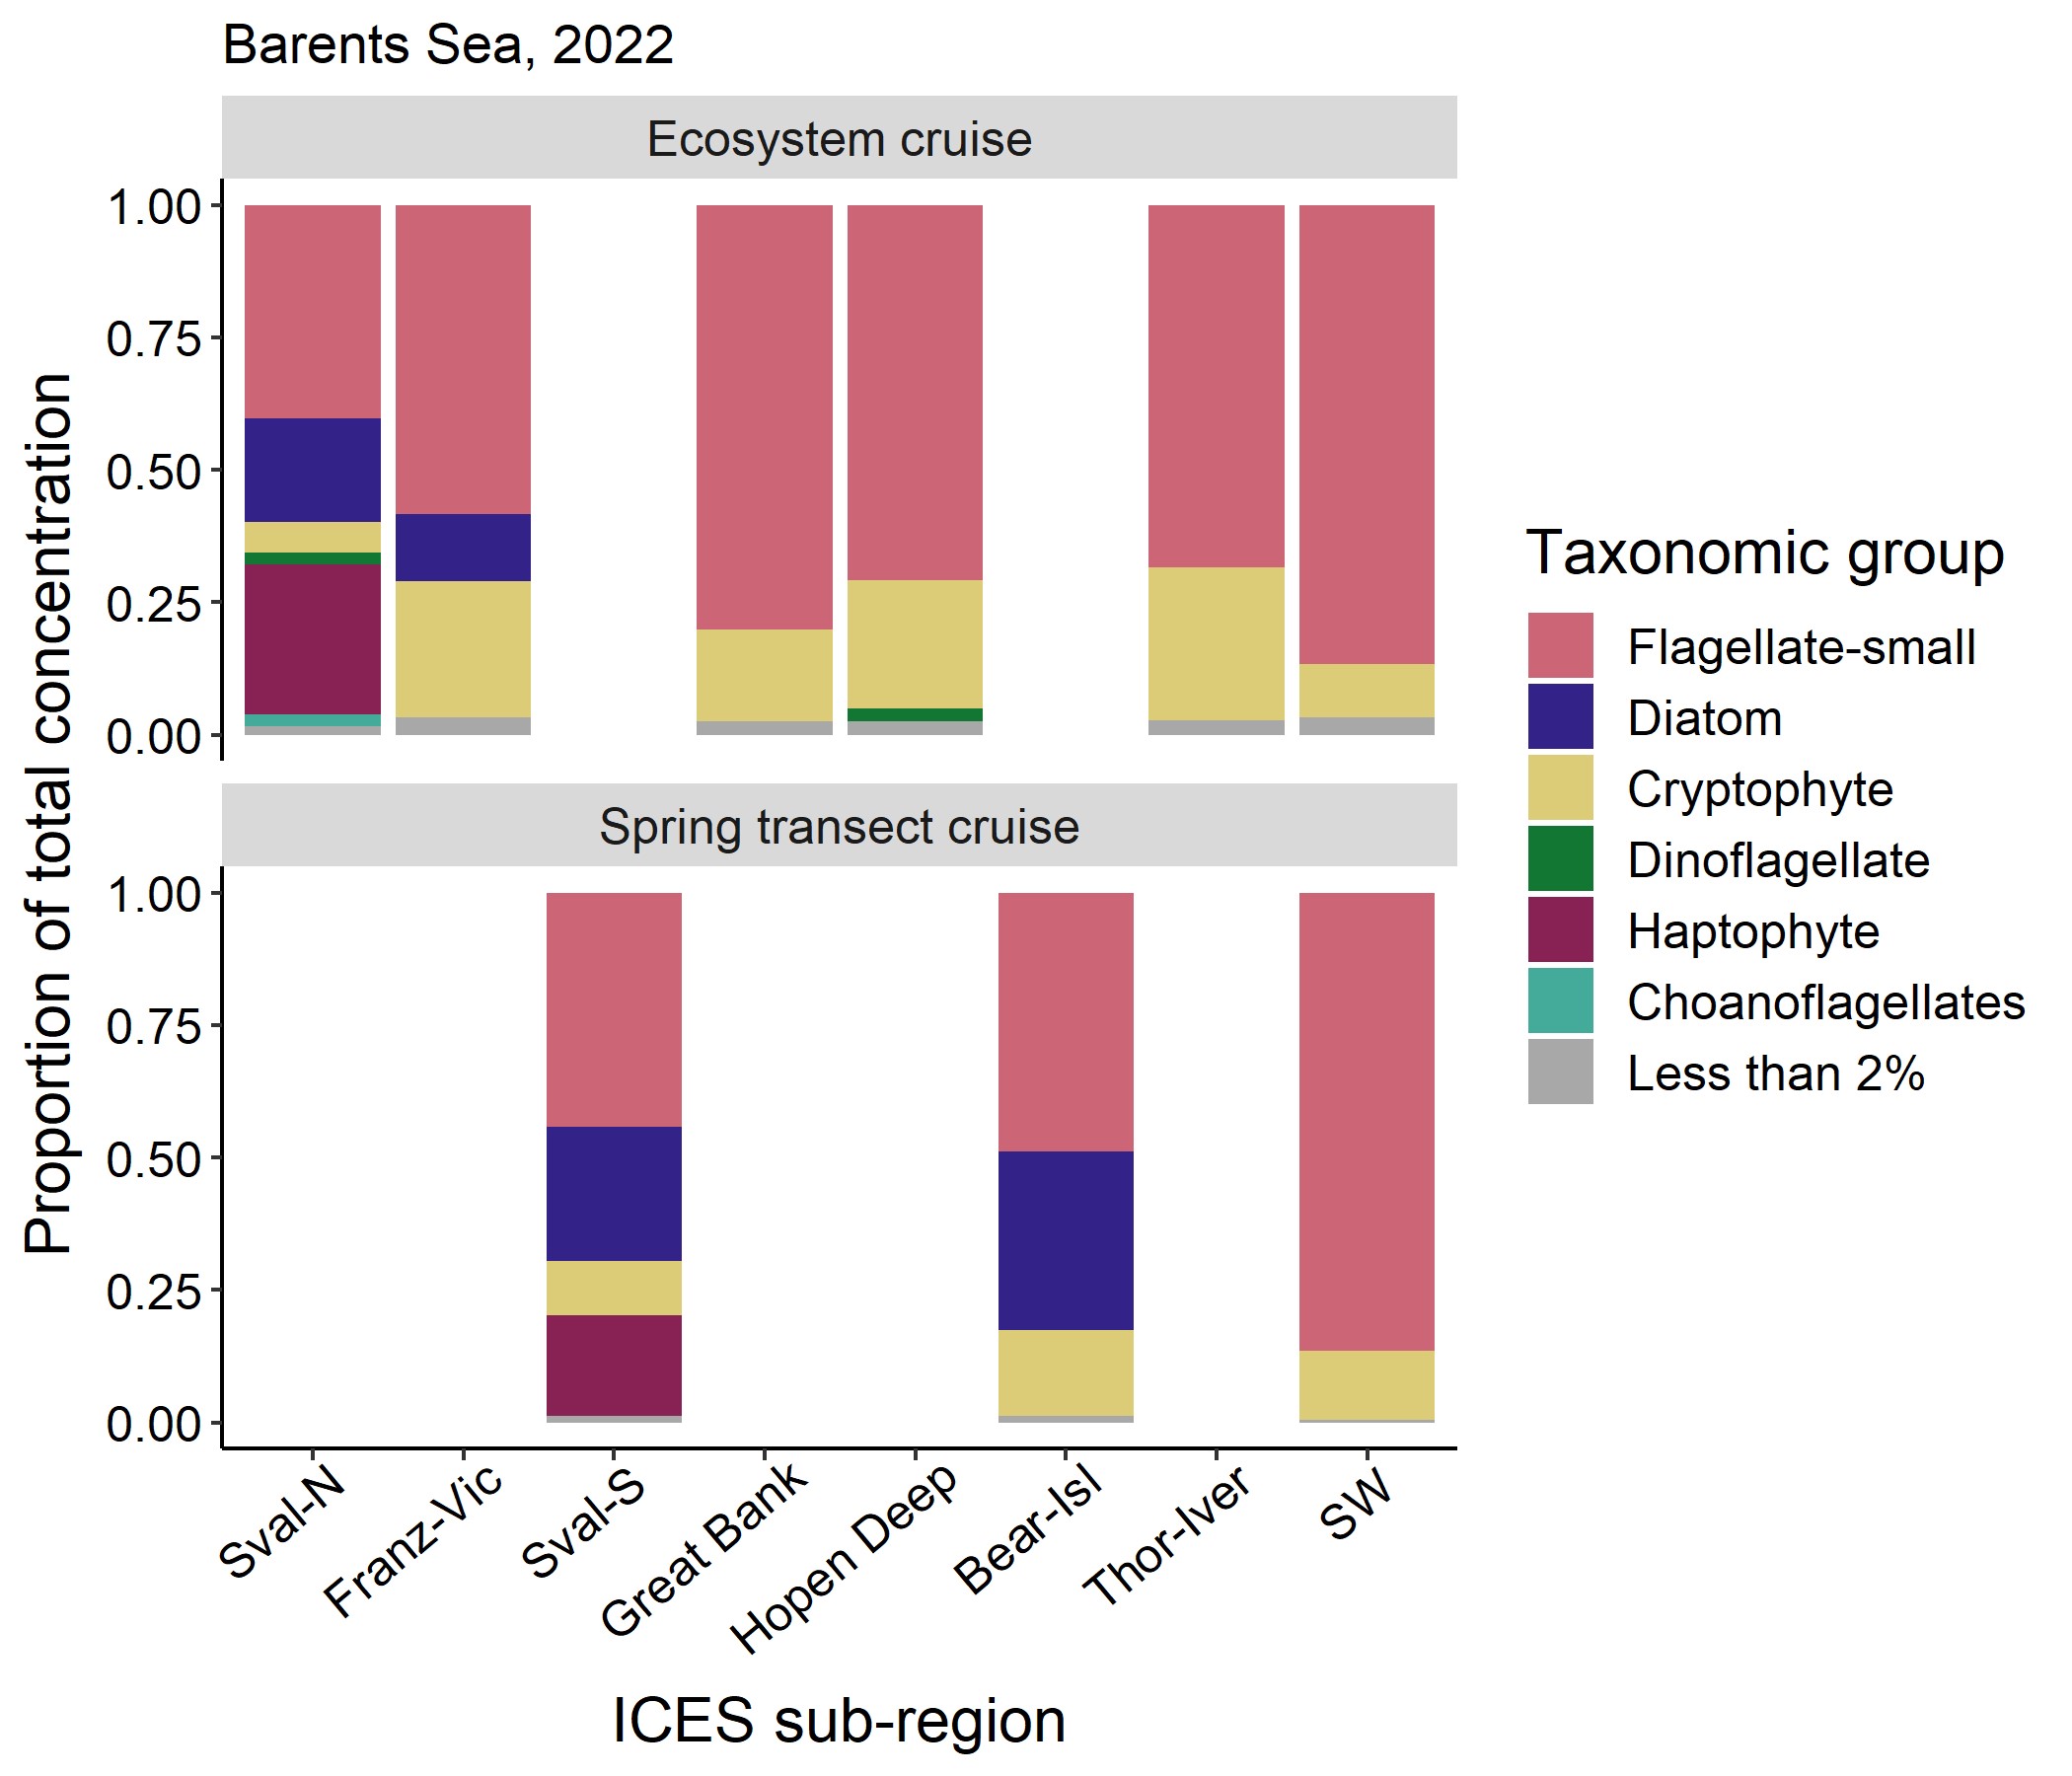
Figure 5.1.4. Bar plot showing the average microplankton community composition at sampled stations by ICES sub-region during the ecosystem and spring transect cruises. All groups which comprised ≤ 2% of the community at a given station are summed for ease of visualization. Sval-N: Svalbard North, Franz-Vic: Franz Victoria Trough, Sval-S: Svalbard South, Bear-Isl: Bear Island Trench, Thor-Iver: Thor Iversen Bank, SW: South West.