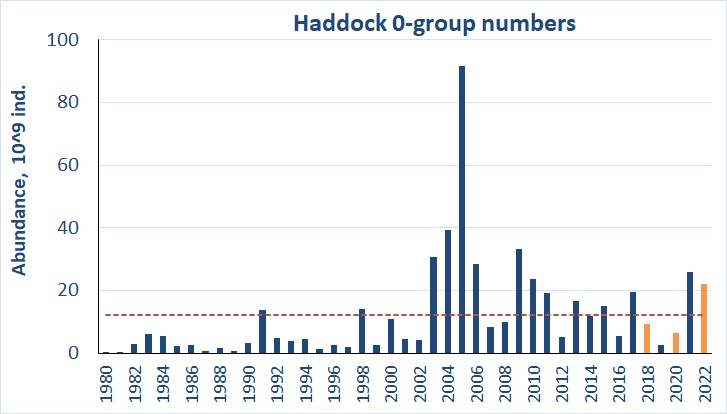
Figure 6.3.2. 0-group haddock estimates corrected for capture efficiency (Keff) for the period 1980-2022. Red line shows the long-term average. Abundance indices for 2018, 2020 and 2022 were corrected for lack of coverage and shown by orange columns.