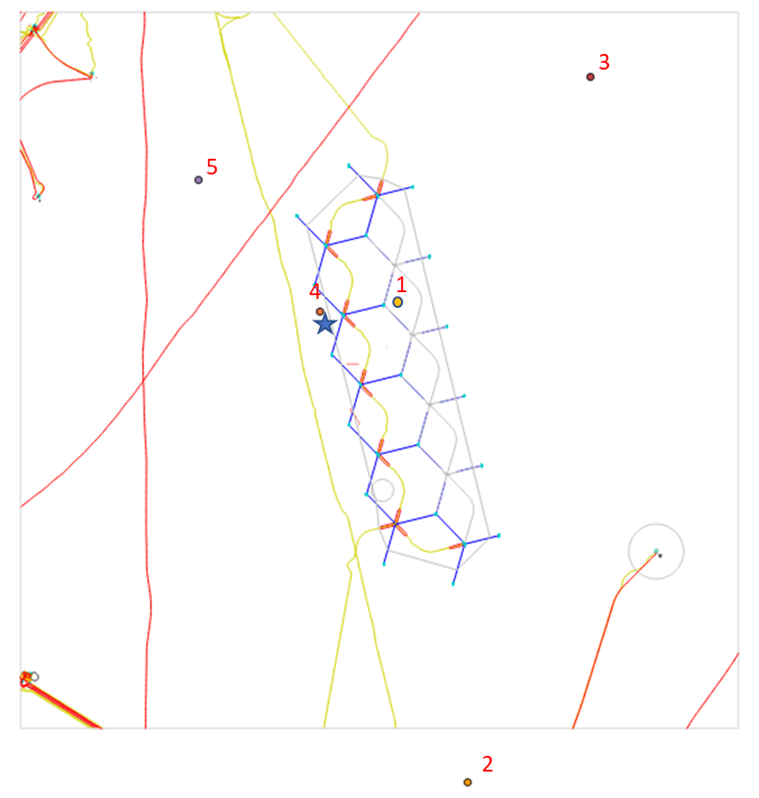
Figure 2. Map showing the positions where we deployed moorings at Hywind Tampen. The positions of the 5 ADCPs are marked with number 1 to 5, and the hydrophone marked with a blue star. The coordinates of the moorings are given in Table 2. Hywind Tampen windfarm: yellow line is cable, blue lines are anchor-chains. Turbines are positioned in the middle of three anchor-chains.