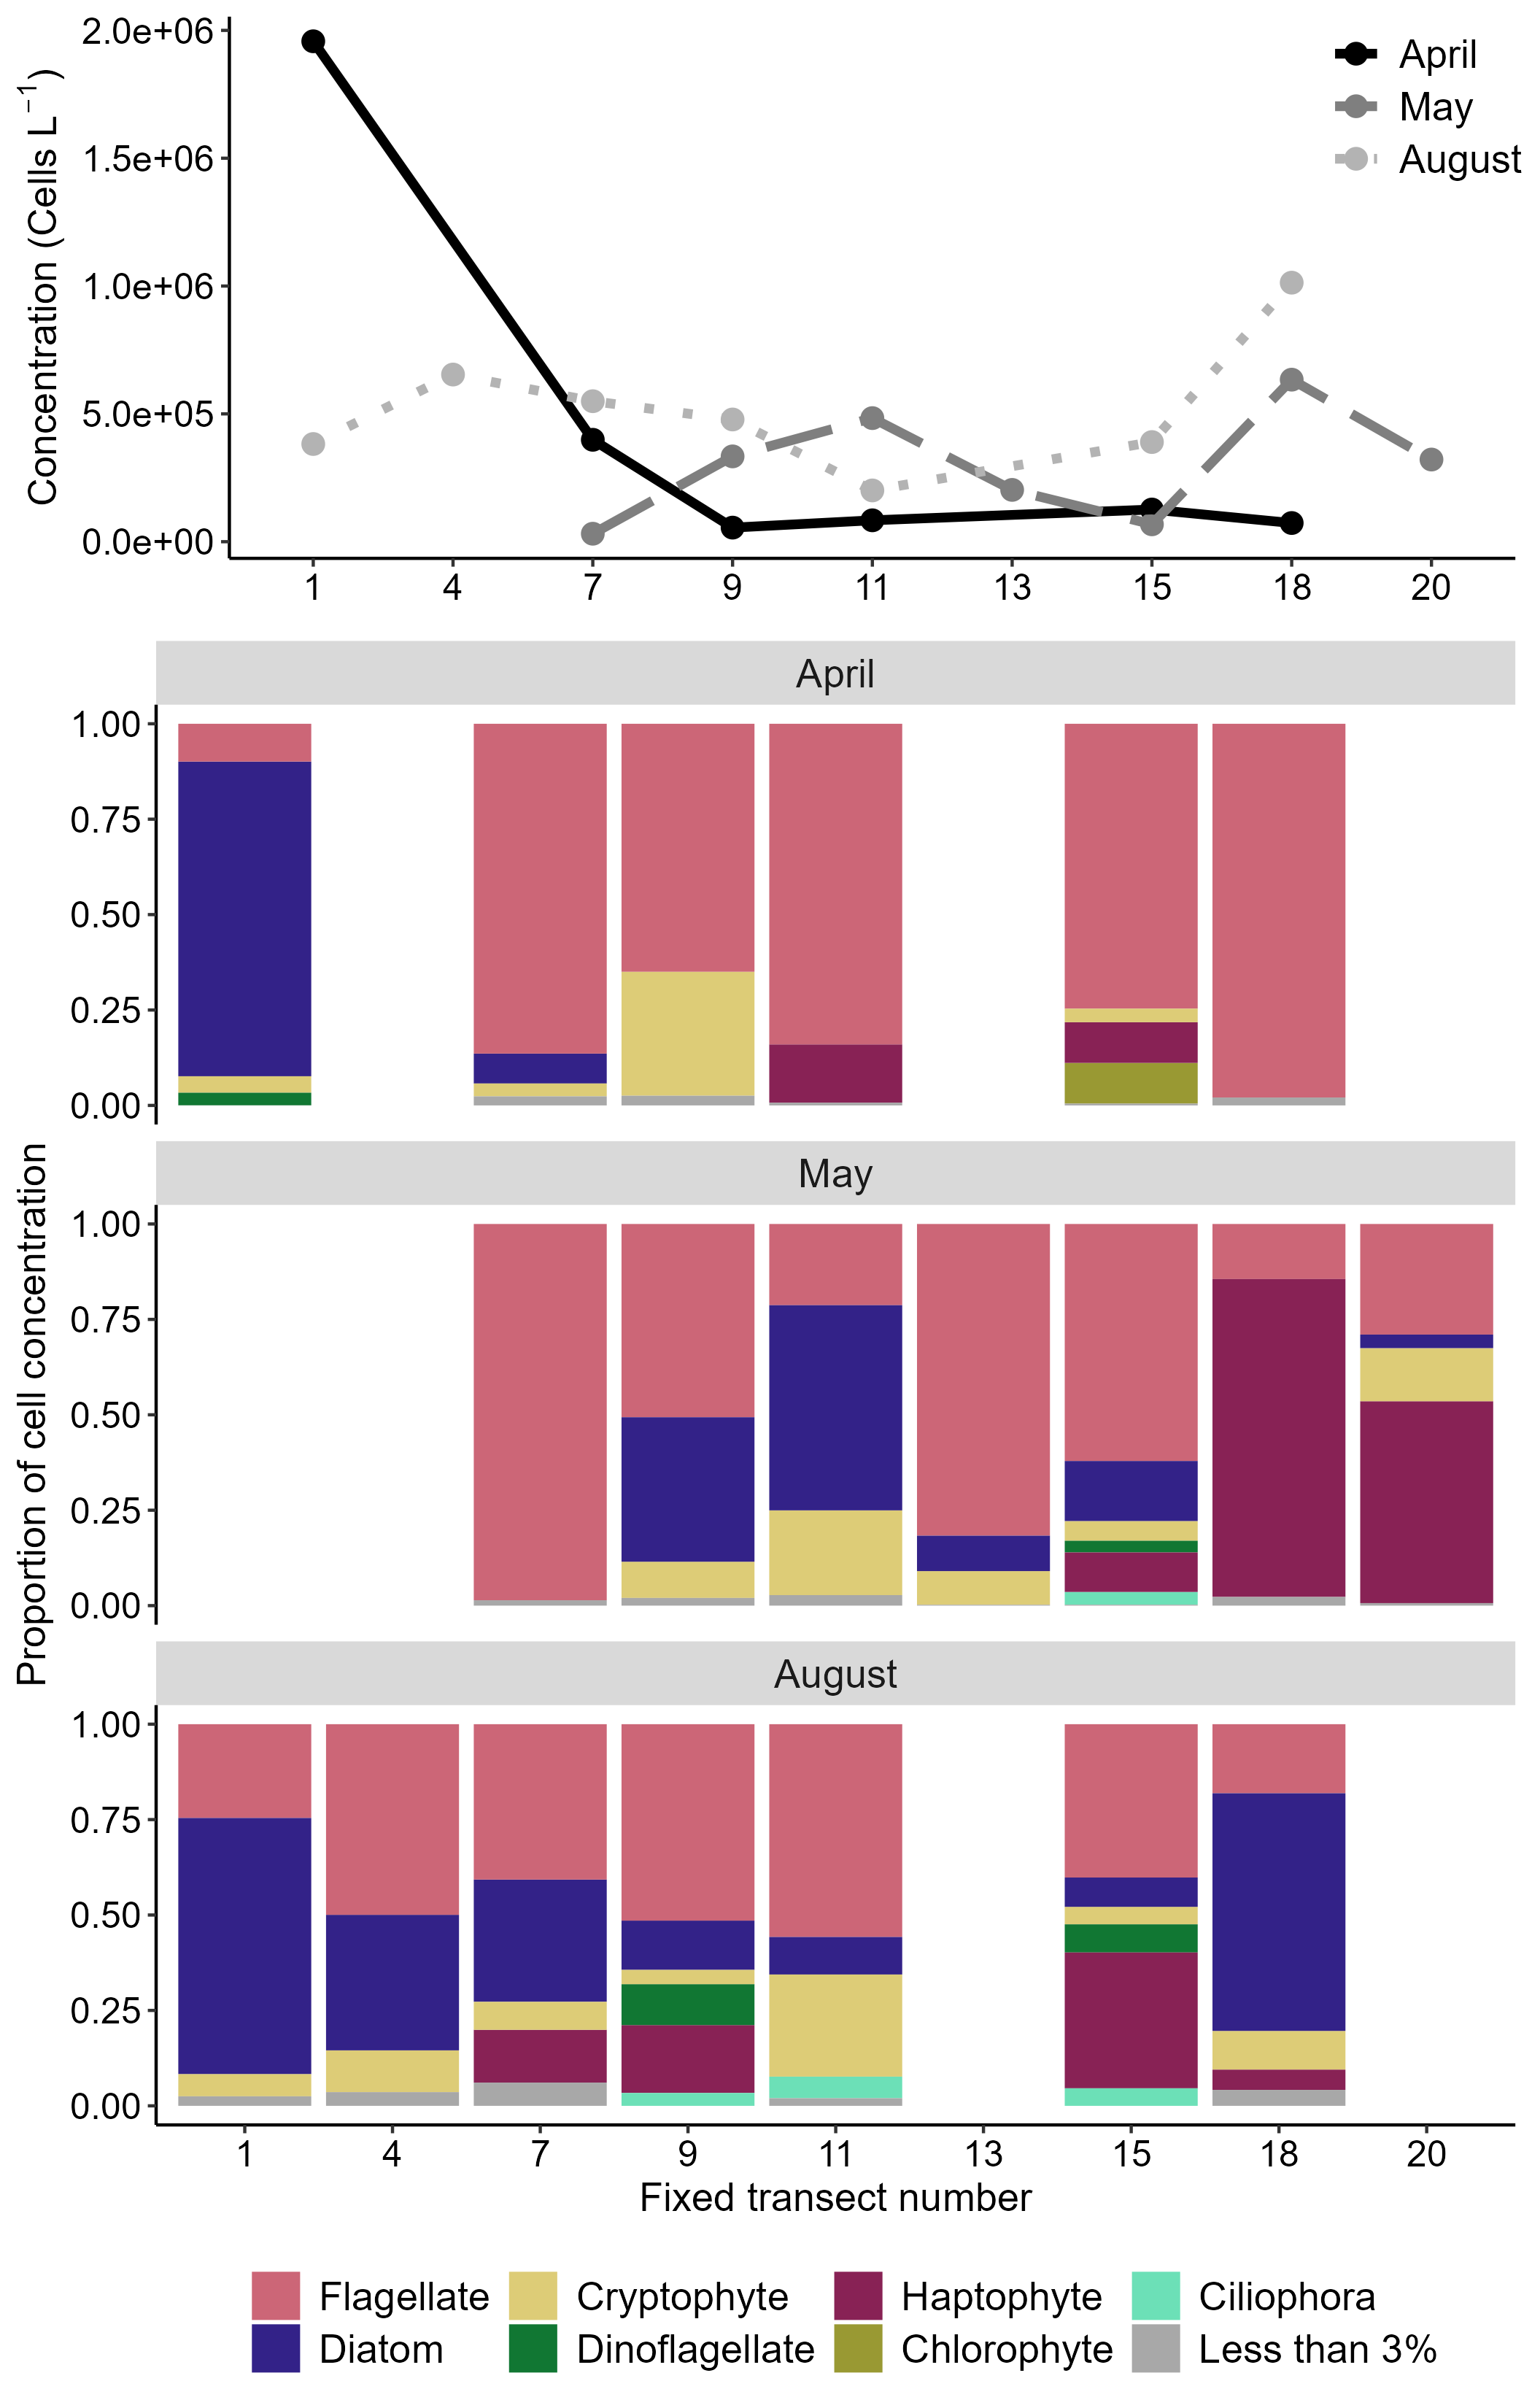
Figure 5.1.4. Plots showing patterns in microplankton abundance (top) and community composition (bottom) along the Fugløya-Bjørnøya transect over three months in 2023. All groups which comprised < 3% of the community at a given station are summed for ease of visualization. Fixed station numbers increase as station locations move north.