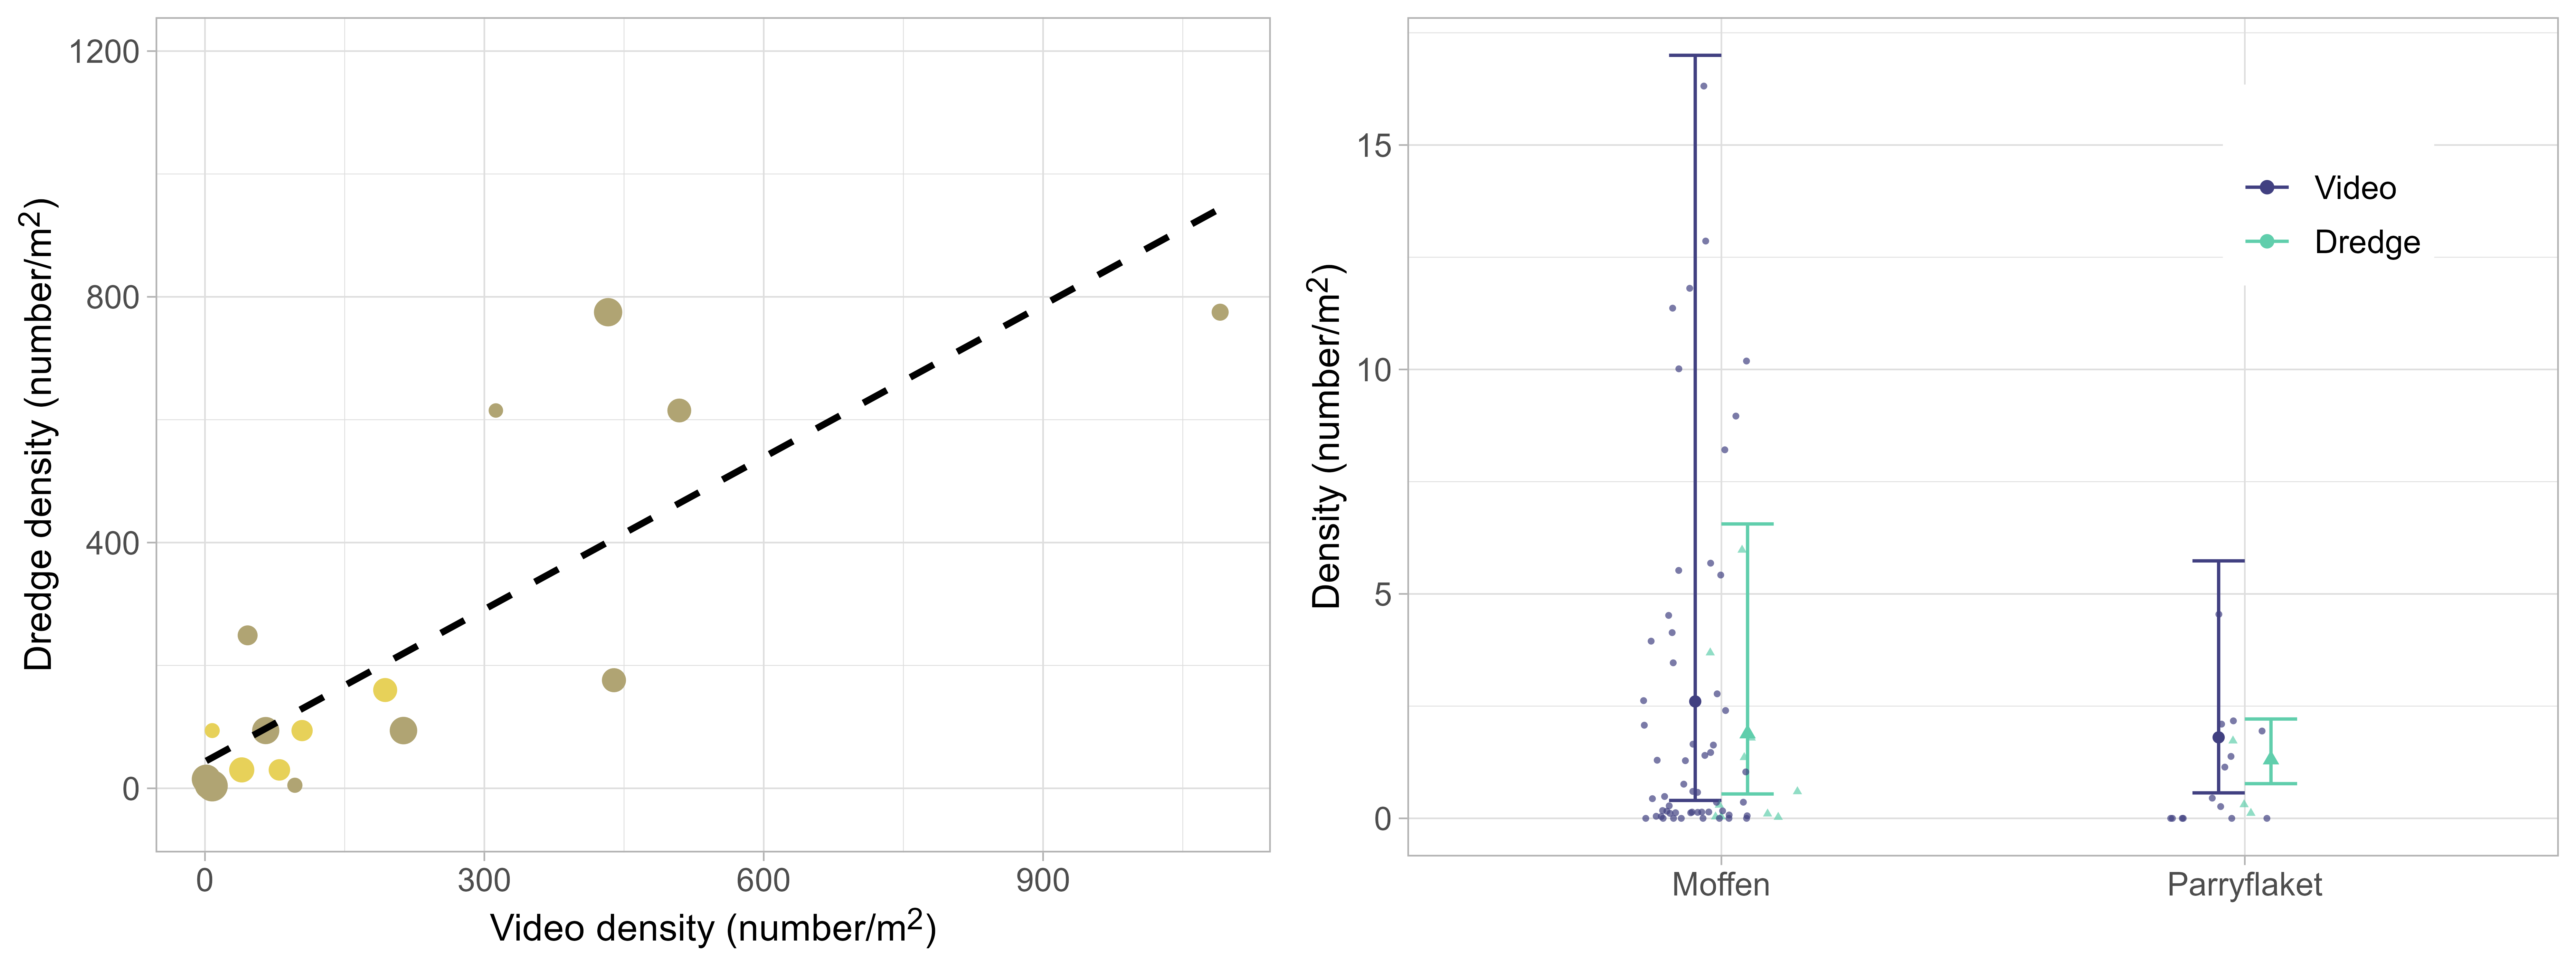
Figure 5: Observed densities as number of scallops per m2 caught by dredging and counted on video transects. Dots are pairs of parallel dredge and video stations with a maximum distance of 3 nmi between them. Size of dots is inversely scaled to their distance (the closer the larger) and colors represent the different scallop beds from the survey in 2022 (Moffen and Parryflaket). The dashed line represents a linear regression between the two gear types.