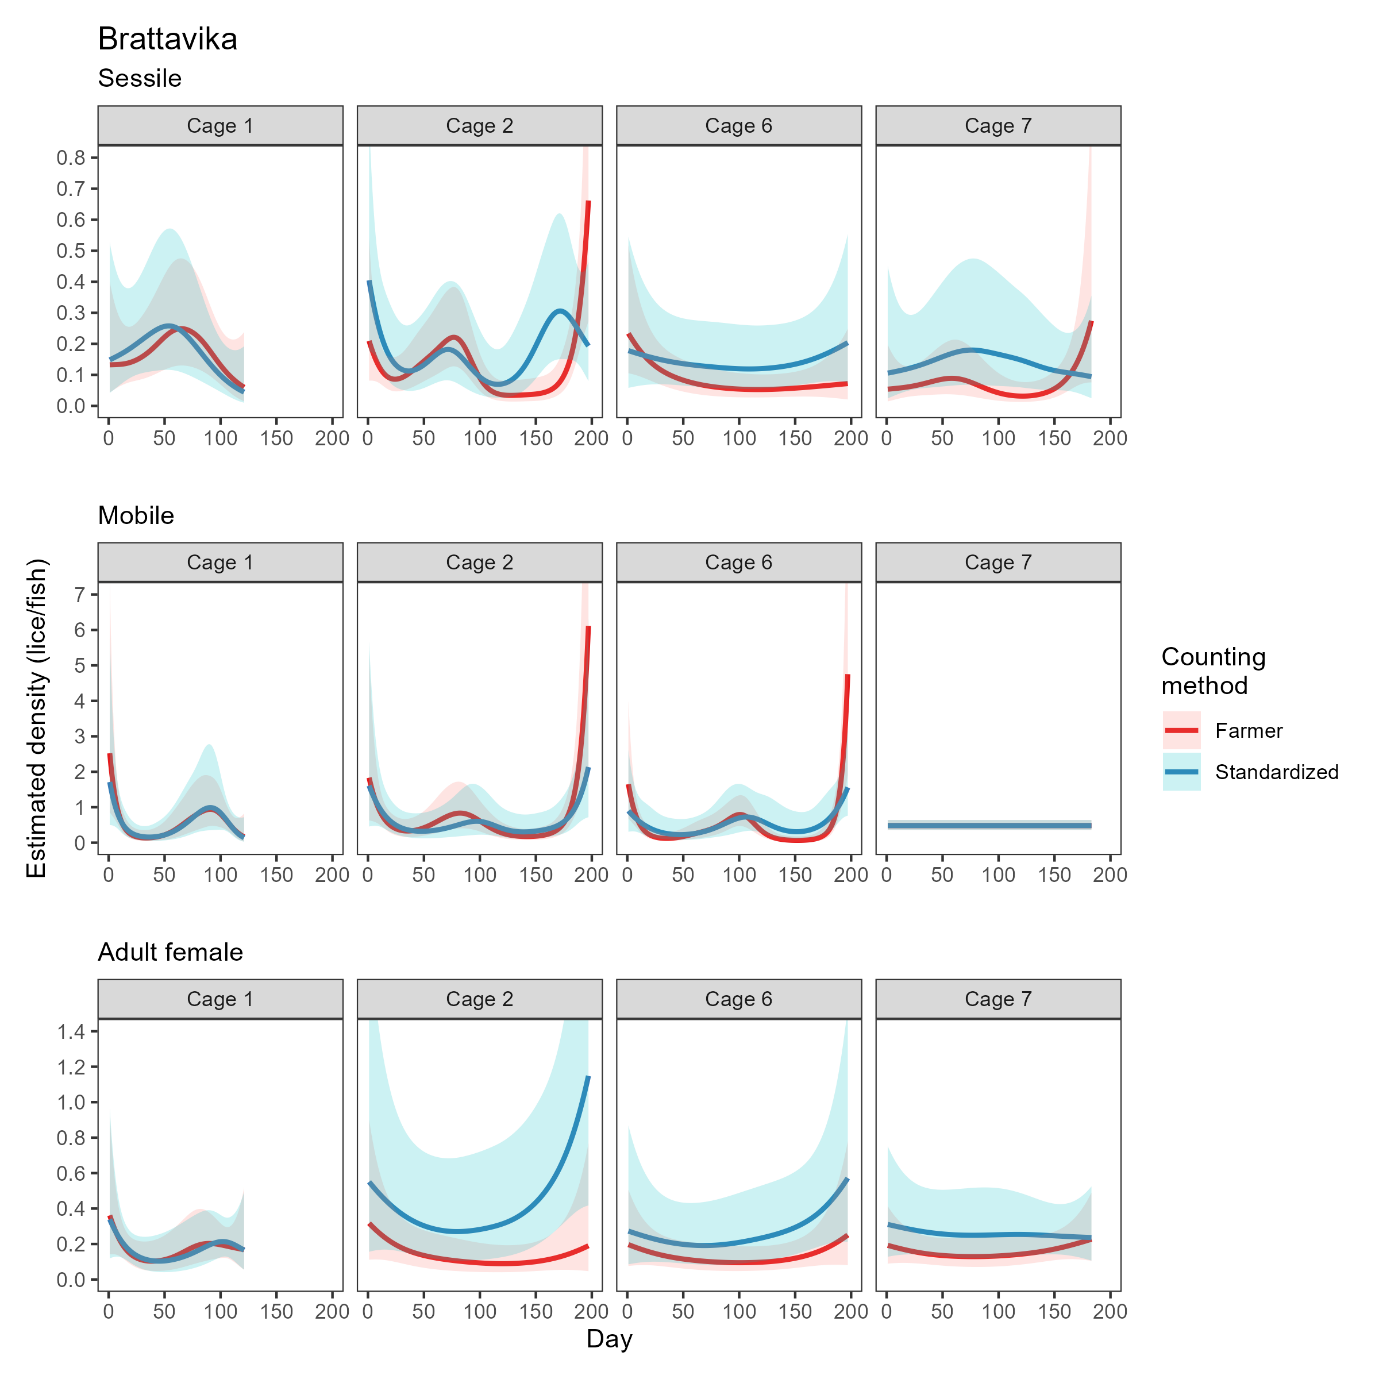
Figure 5. Model fits from 12 generalized additive models (see ‘Model 4’) comparing the estimated cage mean density of salmon louse life stages at Brattavika according to farmer and standardised counts from 4 Jan 2024 (Day 1) to 15 Jul 2024 (Day 197), or else the last date on which a standardised count was performed in each cage. The smoothed lines and shaded regions show the model fit and 95% confidence interval.