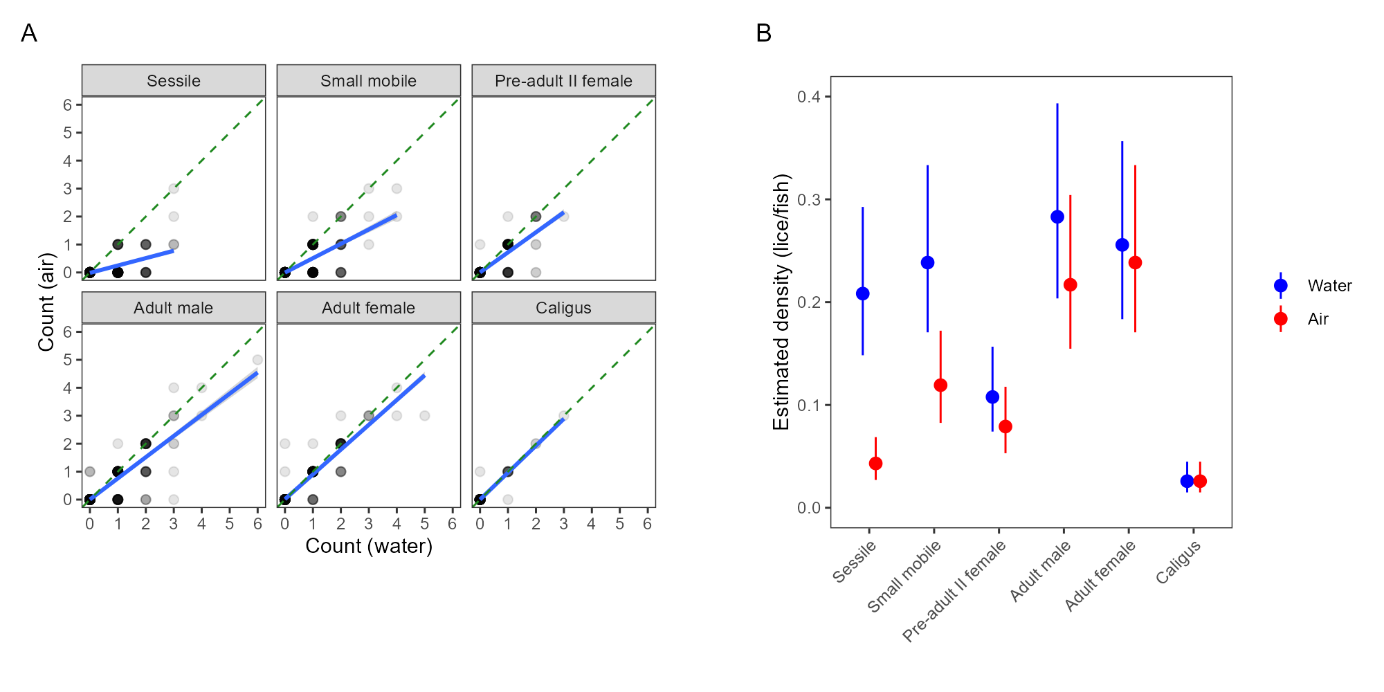
Figure 6. (A) Correlation plot showing deviation from 1:1 agreement between counts in water and counts in air during the large scale trial at Brattavika. The blue line (linear fit) having a lesser slope than the dashed green line (1:1 agreement) indicates that counts in air tend to result in fewer detections than counts in water. Each point represents an individual fish. Overlapping points are indicated by opacity (more opaque = more overlapping points). (B) Marginal predictions from Model 6 showing estimated louse densities according to louse class and counting medium (fish held in water or air during count). Overall louse levels are based on the population-level estimate across all cages and samples.