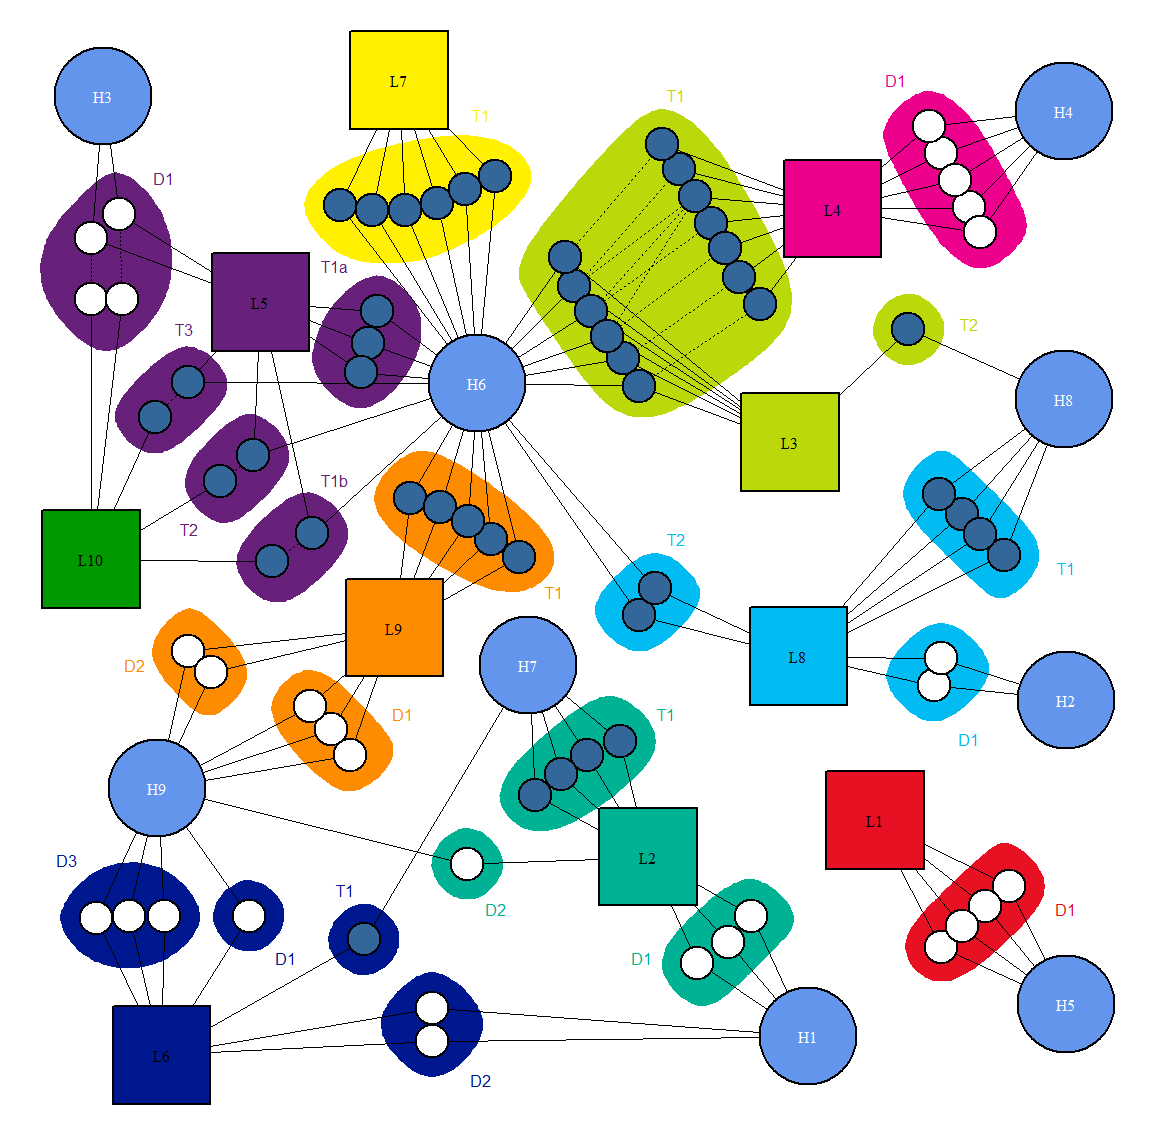
Figure 14. Fish group network, showing the connections between hatcheries (circles), farms (squares), and sea cages with individual fish group (small circles). The fish type present at each node is shown by the filled colour of the circle, where blue=triploid and white=diploid. The sea cages are marked with their respective farms, and clustered into the groups found in Table 1. Dotted lines connecting nodes indicate farm moves, while solid lines connect hatcheries with the original farm localities