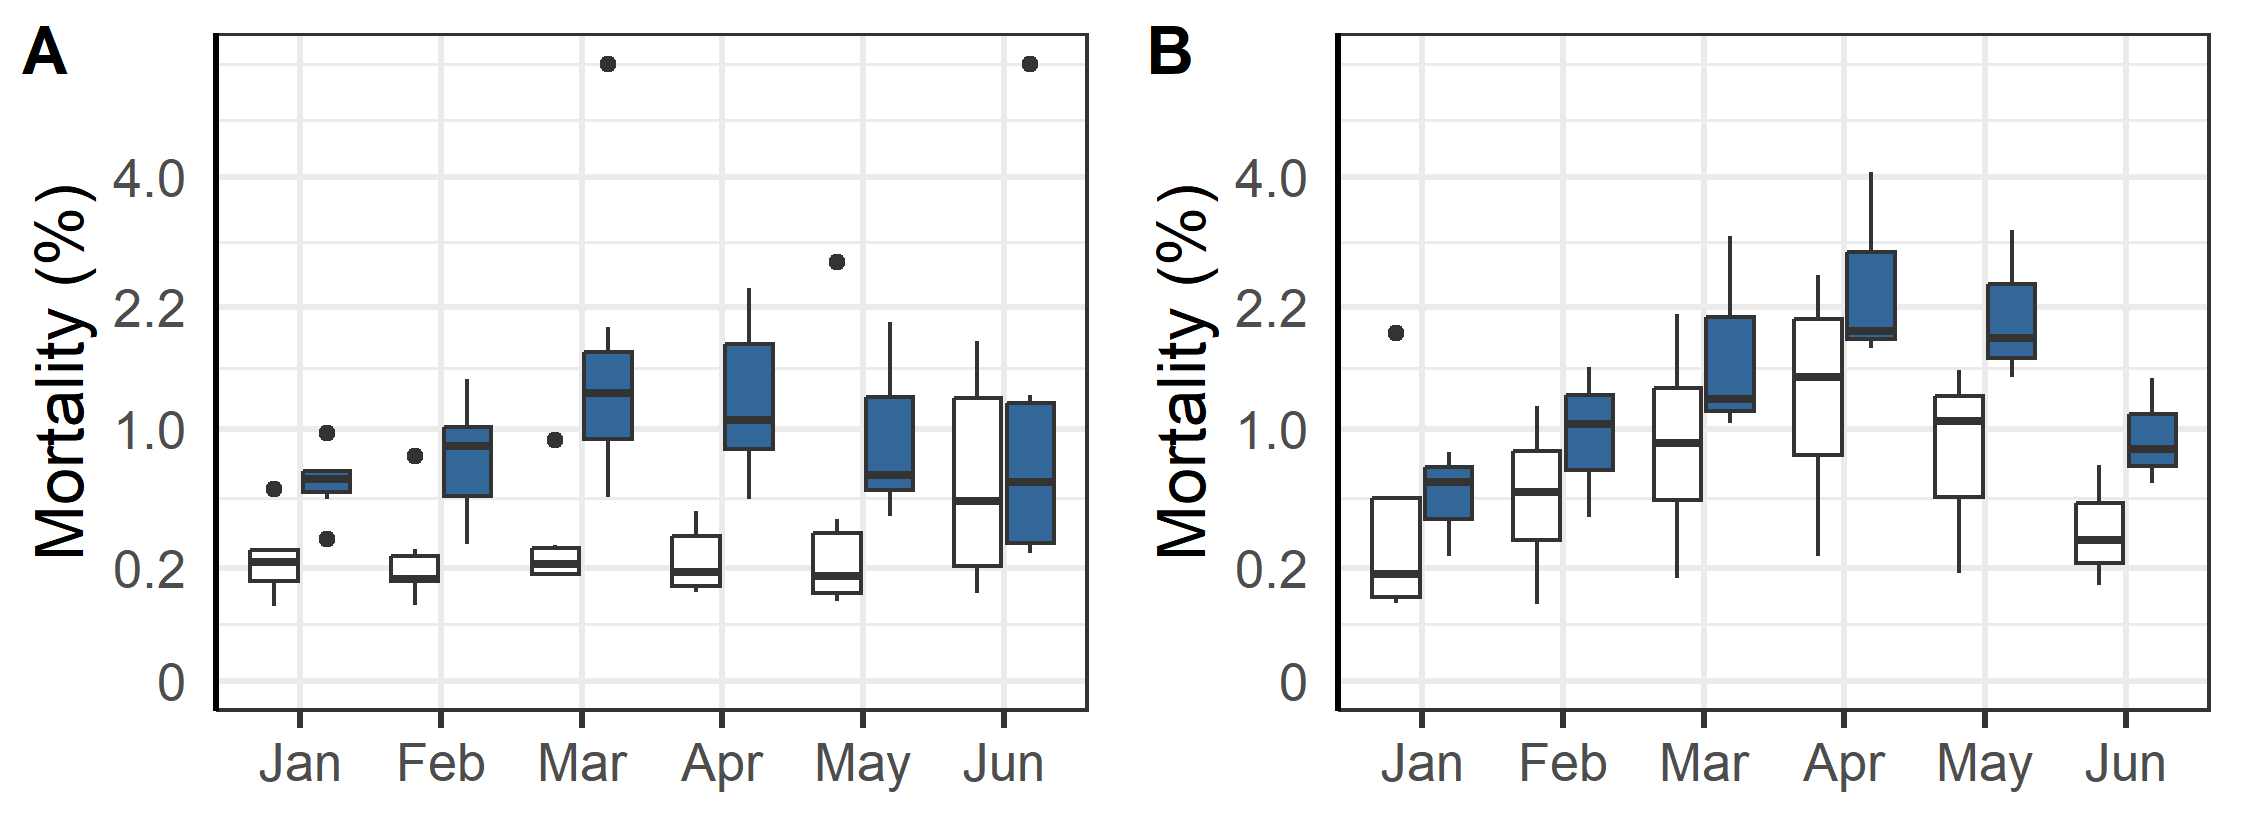
Figure 2: Mortality (dead + euthanised) development during the first winter in the sea (January to June) for fish transferred to sea in the spring-summer (A) and the autumn (B) for diploid (white) vs. triploid (blue) salmon. The middle line of the boxplots is the median, the upper and lower parts of the boxes are the 75- and 25-percentiles, the whiskers the highest/smallest value within the 1.5*the interquartile range, and the dots the values outside the whiskers.