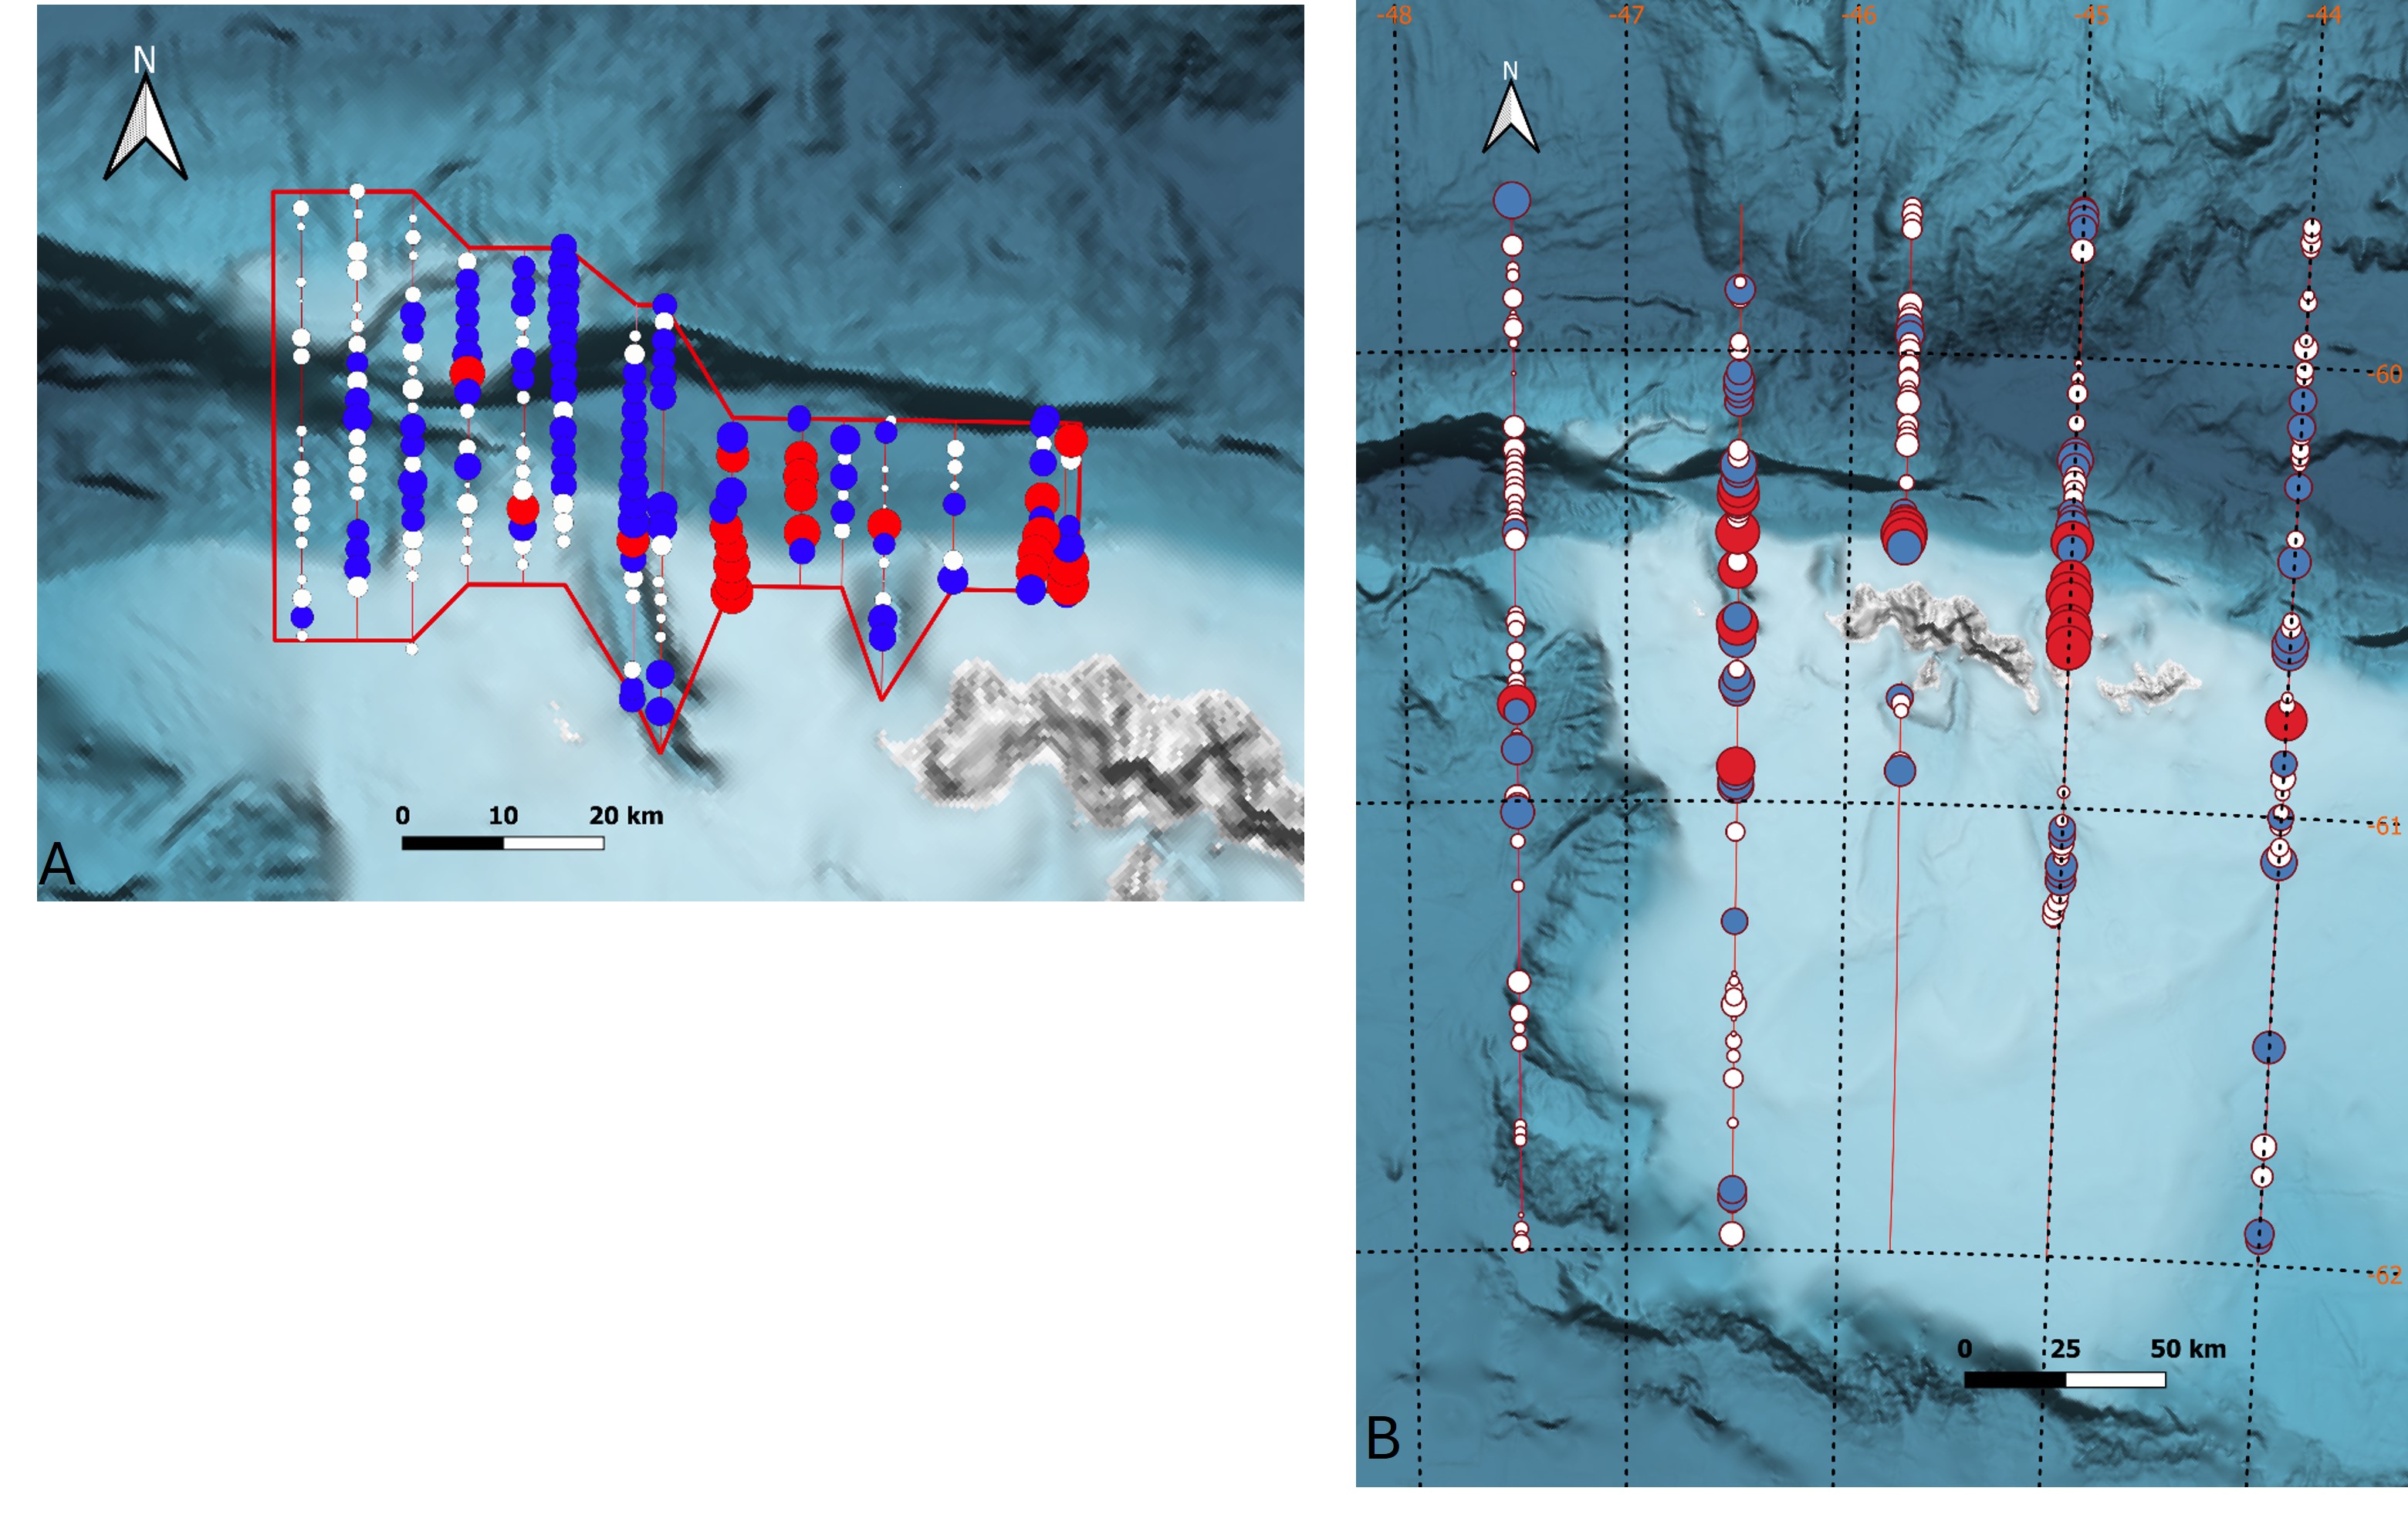
Figure 8. Distribution of Nautical Area Scattering Coefficients (NASC; m2/nmi2) allocated to E. superba from the 120 kHz recordings at the Shelf edge stratum (A) and overall stratum (B). Log distance is 1 nautical mile. NASC White: 0-100, Blue: 100-1000 and Red 1000-10000).