Gå til hovedinnhold
Havforskningsinstituttet
HI
English
<- Tilbake
Søk
Søk
Søk
View page in English
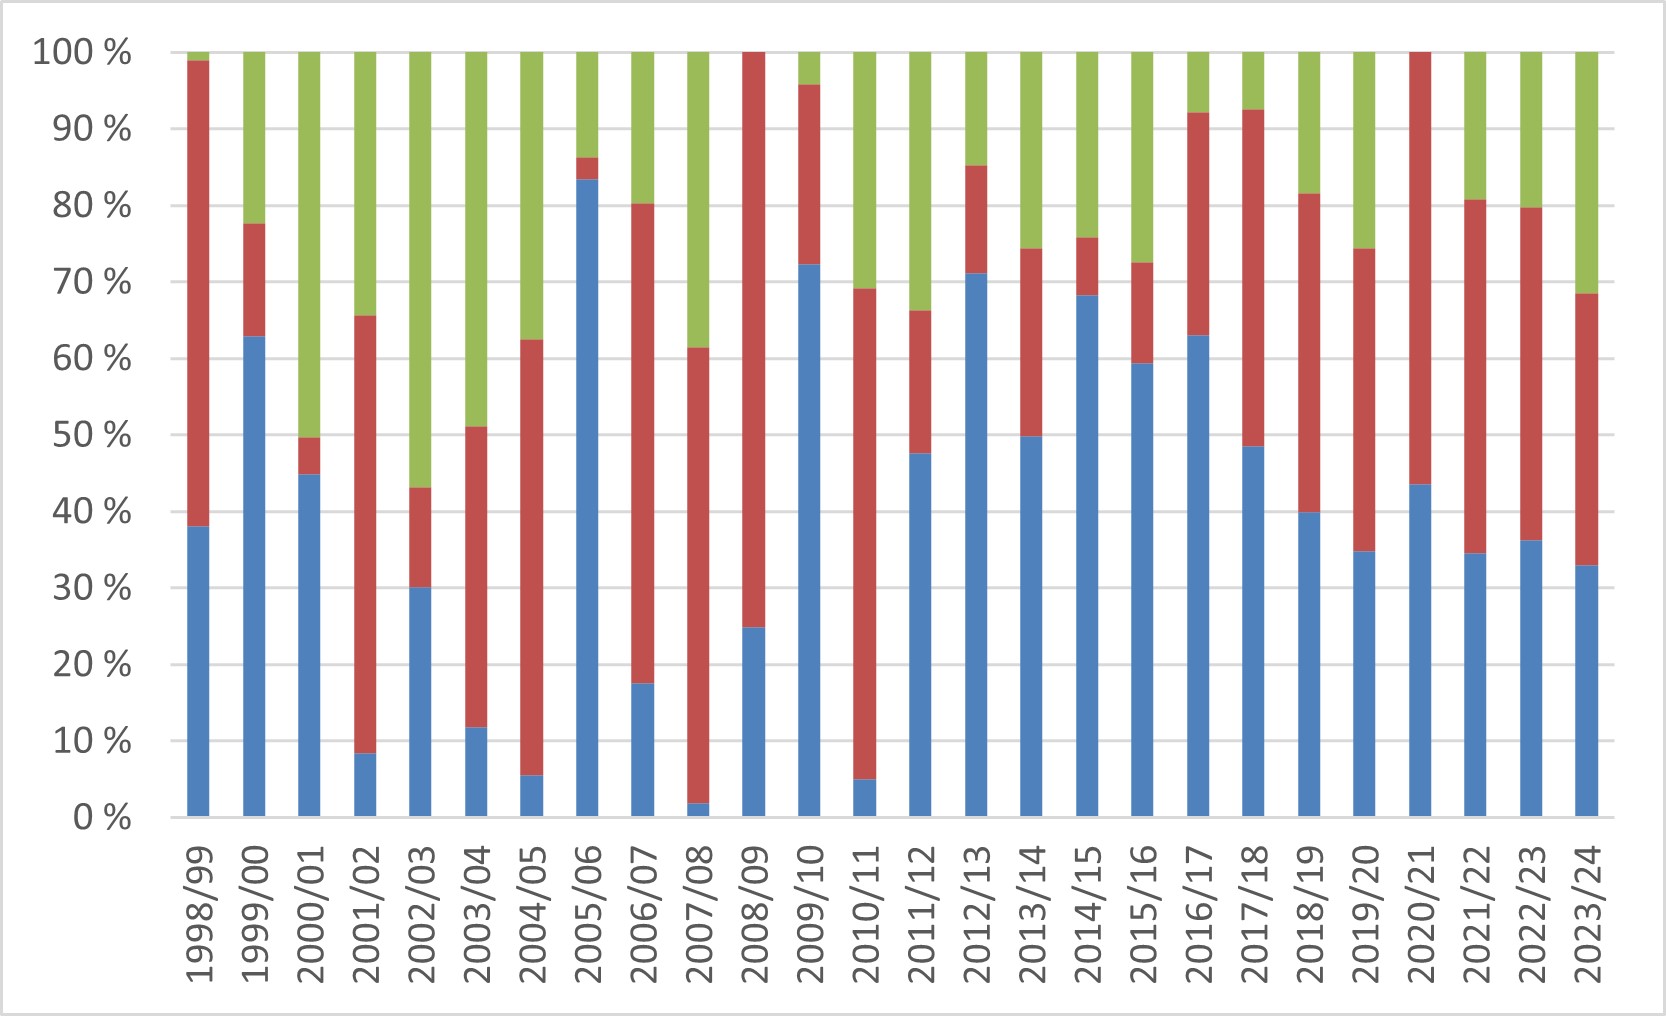
Figur
Fra rapporten:
Antarctic krill and ecosystem monitoring survey off the South Orkney Islands in 2025
Figure 2. Proportional historical distribution of the total reported catch of Antarctic krill in subareas 48.1, 48.2, and 48.3 (48.1 = blue, 48.2 = red, 48.3 = green), (data source: ccamlr.org).