Gå til hovedinnhold
Havforskningsinstituttet
HI
English
<- Tilbake
Søk
Søk
Søk
View page in English
Figur
Fra rapporten:
Joint Russian Norwegian Arctic Fisheries Working Group (JRN-AFWG) Report 2025
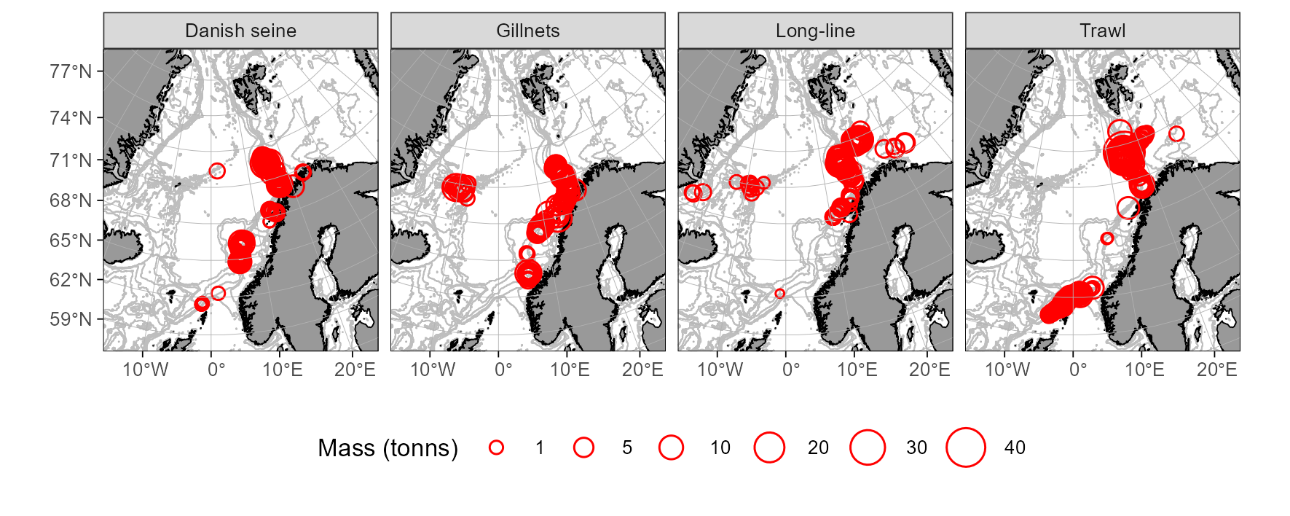
Figure 8.3. Spatial distribution of catches where Greenland halibut make more than 50% of the total catches, according to Norwegian electronic logbooks from 2024. Bubble area is proportional to the size of single catches expressed in metric tonnes.