Figur
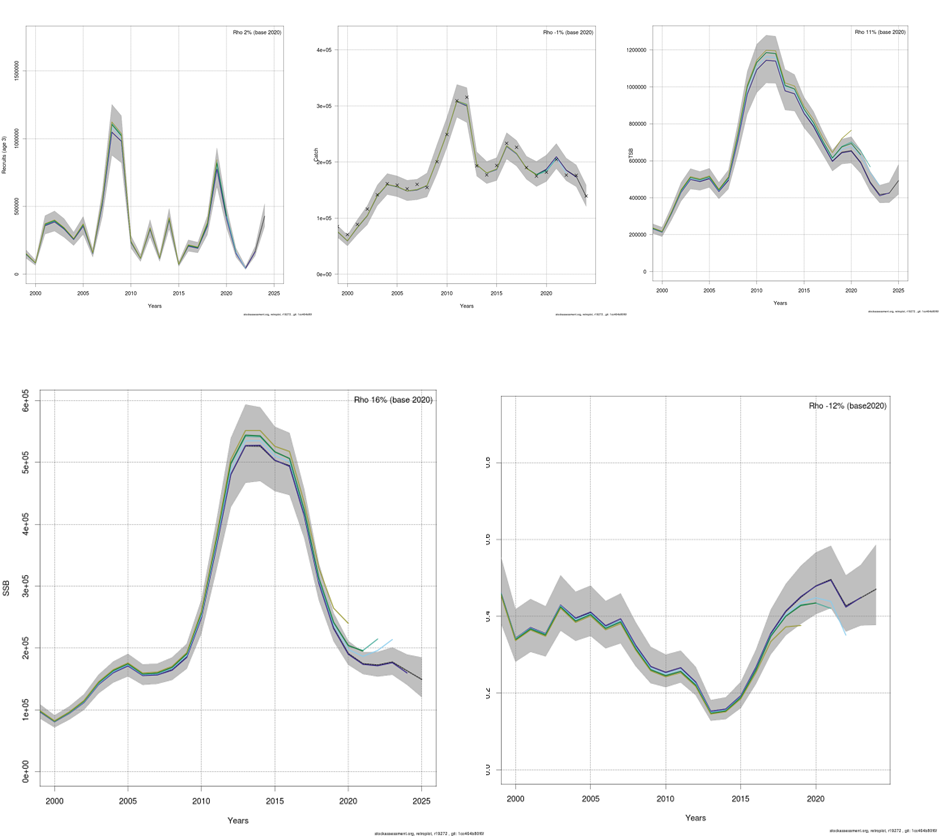
Figure 4.3 Northeast Arctic haddock. 5 year retrospective plots of Recruitment (top left), catch (top middle) and TSB (top right), SSB (bottom left), and fishing mortality TSB (bottom right) for years 1950–2024 (2023 catches and F) (SAM with 95% confidence interval.