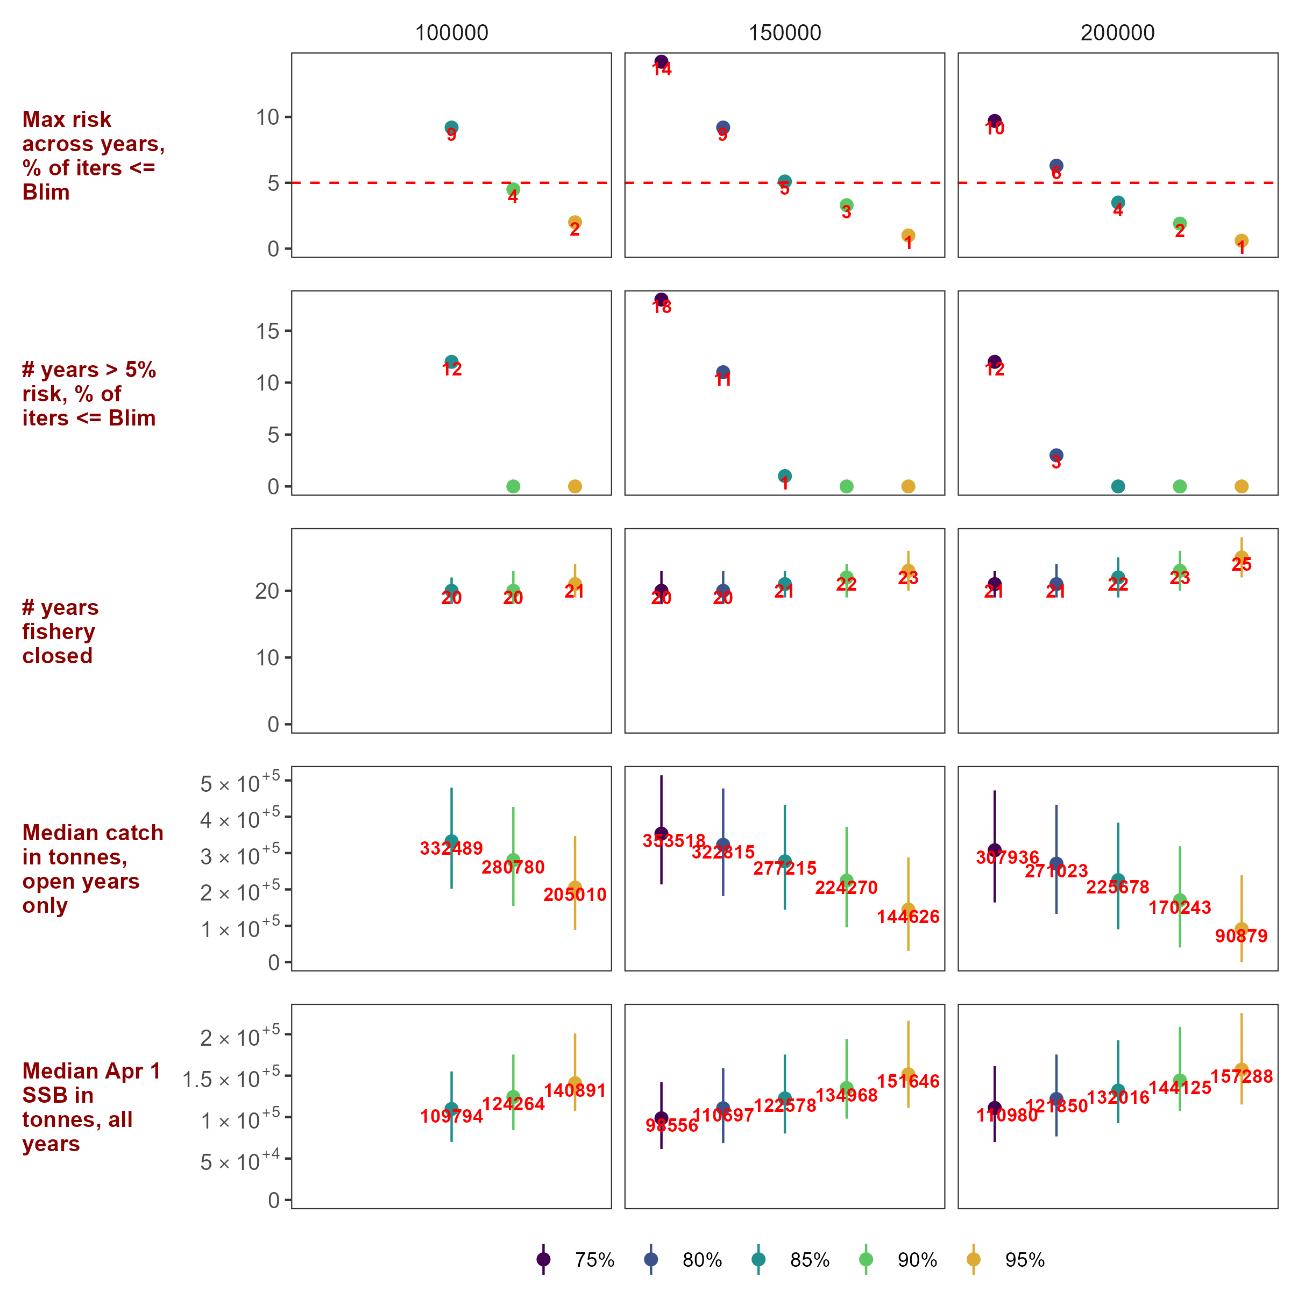
Figure 9.1. Consequences of alternative configurations of the capelin escapement rule. Rows denote the specific consequence calculated (performance statistics), columns separate the Bescapement values, and colors denote alternative risk threshold values used in the HCR. Points represent either a percentage, number of years or a median where indicated. Lines represent the inner 90th quantile of the distributions if the statistic is not a percentage. Statistics are computed from 1,000 iterations.