Gå til hovedinnhold
Havforskningsinstituttet
HI
English
<- Tilbake
Søk
Søk
Søk
View page in English
Figur
Fra rapporten:
Joint Russian Norwegian Arctic Fisheries Working Group (JRN-AFWG) Report 2025
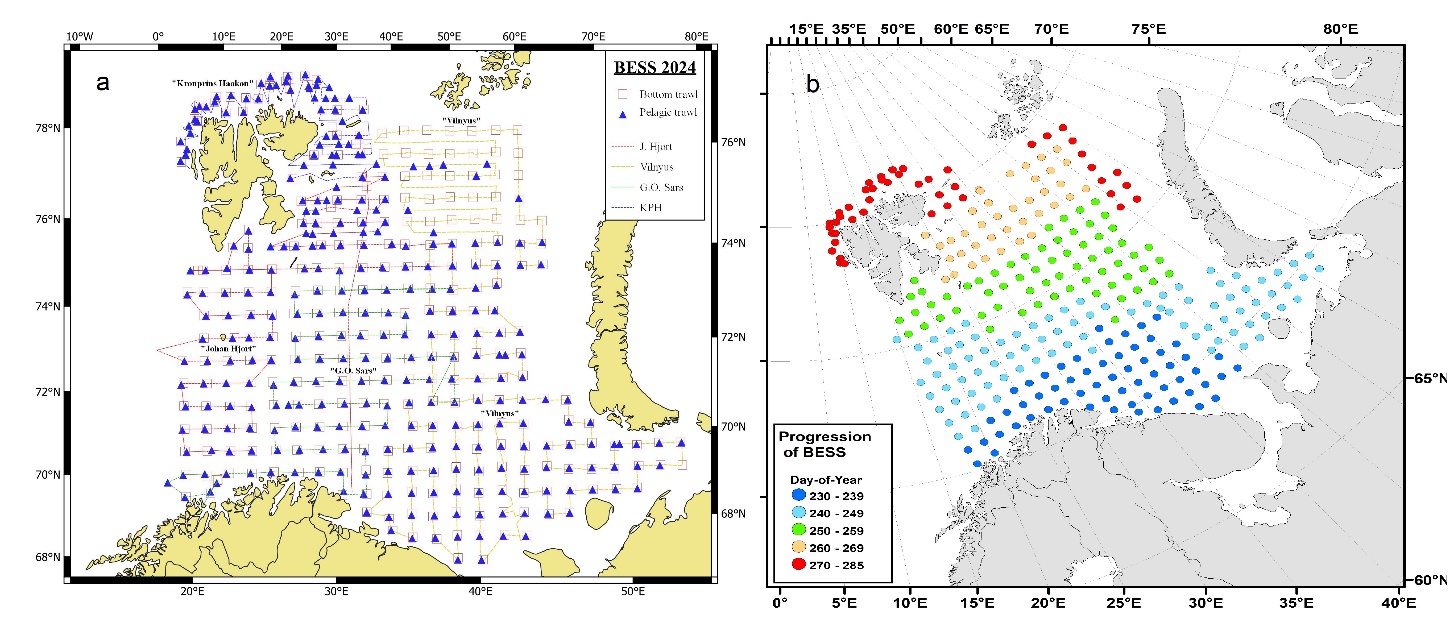
Figure 1.1. The spatial (a, left) and temporal (b, right) progression during the survey.