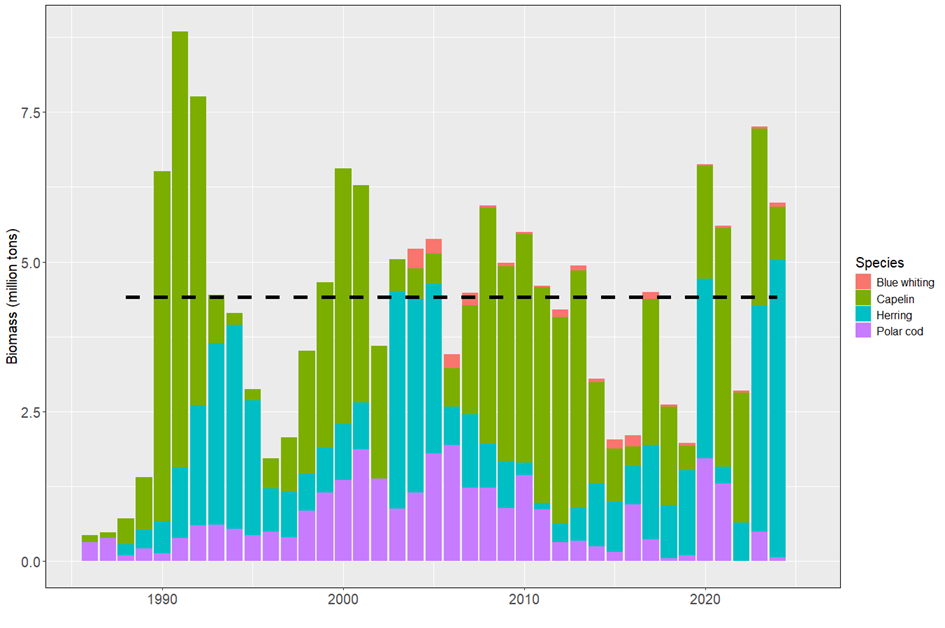
Figure 1.4. Total biomass of pelagic fish (excluding 0-group) in the Barents Sea in 1986-2024. Note that herring survey estimates are available from 1999 and blue whiting estimates from 2004. Biomass estimates for herring between 1988 and 1998 are derived from the NSS-herring assessment (age 1-3). The dashed line denotes average biomass summed over all the included pelagic species for 1988-2024.