Gå til hovedinnhold
Havforskningsinstituttet
HI
English
<- Tilbake
Søk
Søk
Søk
View page in English
Figur
Fra rapporten:
Joint Russian Norwegian Arctic Fisheries Working Group (JRN-AFWG) Report 2025
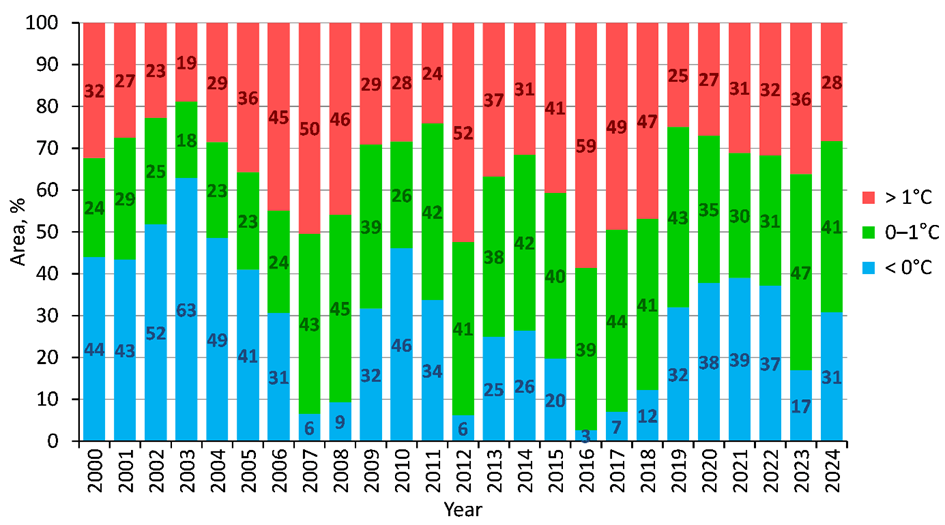
Figure 1.3. Area of bottom waters with different temperature ranges in the Barents Sea in September-October 2000-2024.