Gå til hovedinnhold
Havforskningsinstituttet
HI
English
<- Tilbake
Søk
Søk
Søk
View page in English
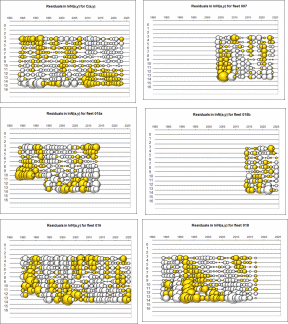
Figur
Fra rapporten:
Joint Russian Norwegian Arctic Fisheries Working Group (JRN-AFWG) Report 2025
Figure 3. 6 .a. Residuals of the TISVPA data approximation (yellow circles are positive residuals, white – negative).