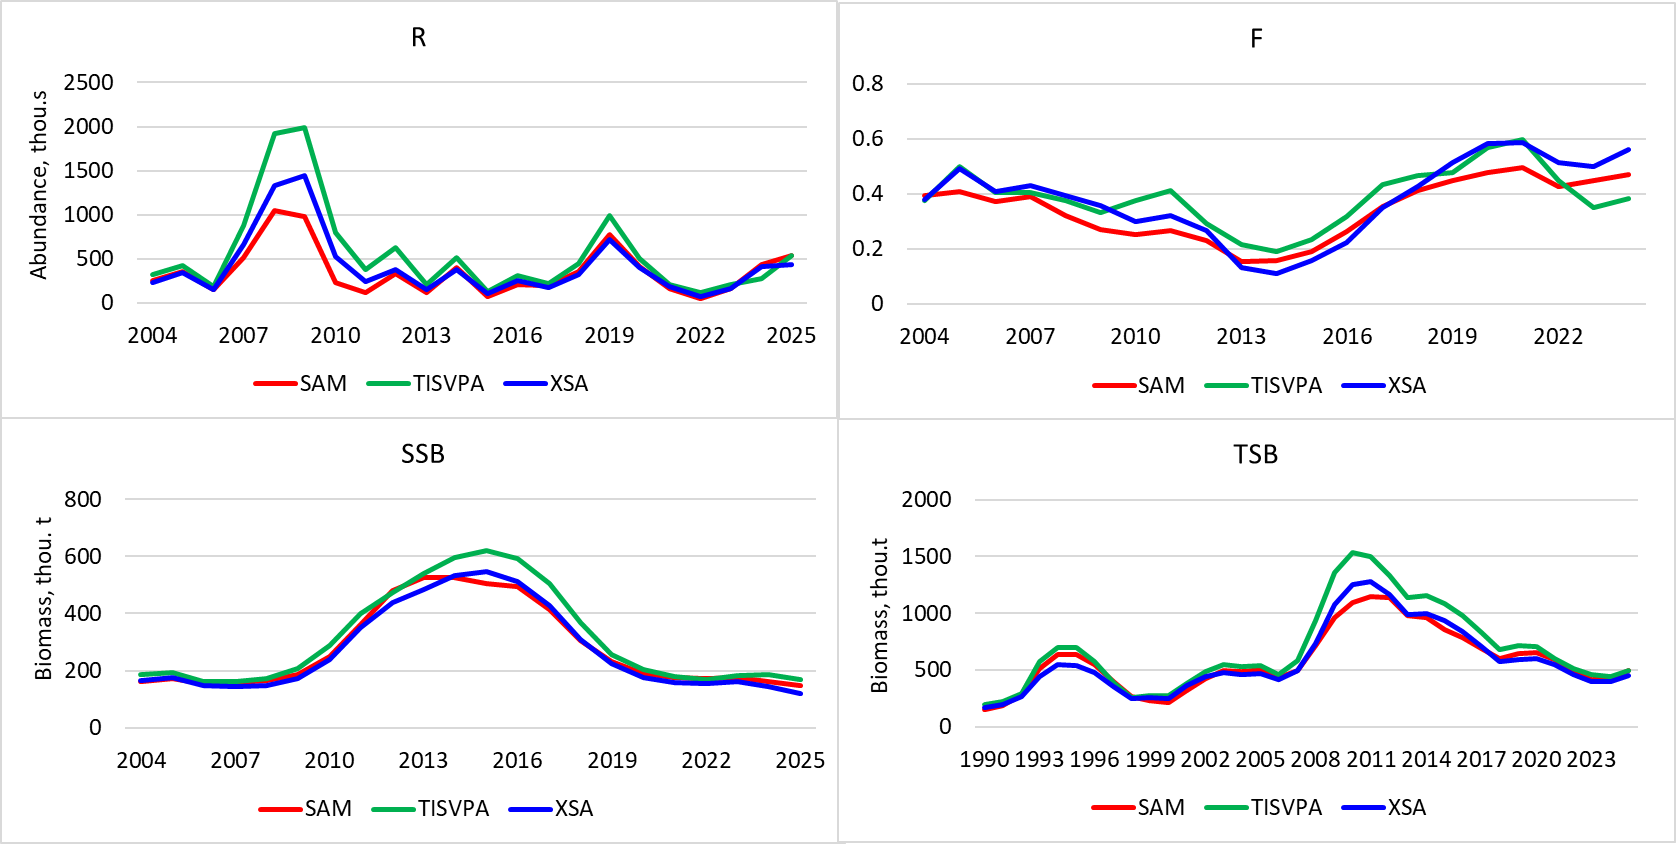
Figure 4.6. Comparison of results of assessment of NEA haddock. Recruits, biomass, spawning biomass and F in 1990–2025 by different models: median SAM estimates, XSA with setting mentioned at section 4.9 and TISVPA with settings established in WKDEM 2020.