Gå til hovedinnhold
Havforskningsinstituttet
HI
English
<- Tilbake
Søk
Søk
Søk
View page in English
Figur
Fra rapporten:
Joint Russian Norwegian Arctic Fisheries Working Group (JRN-AFWG) Report 2025
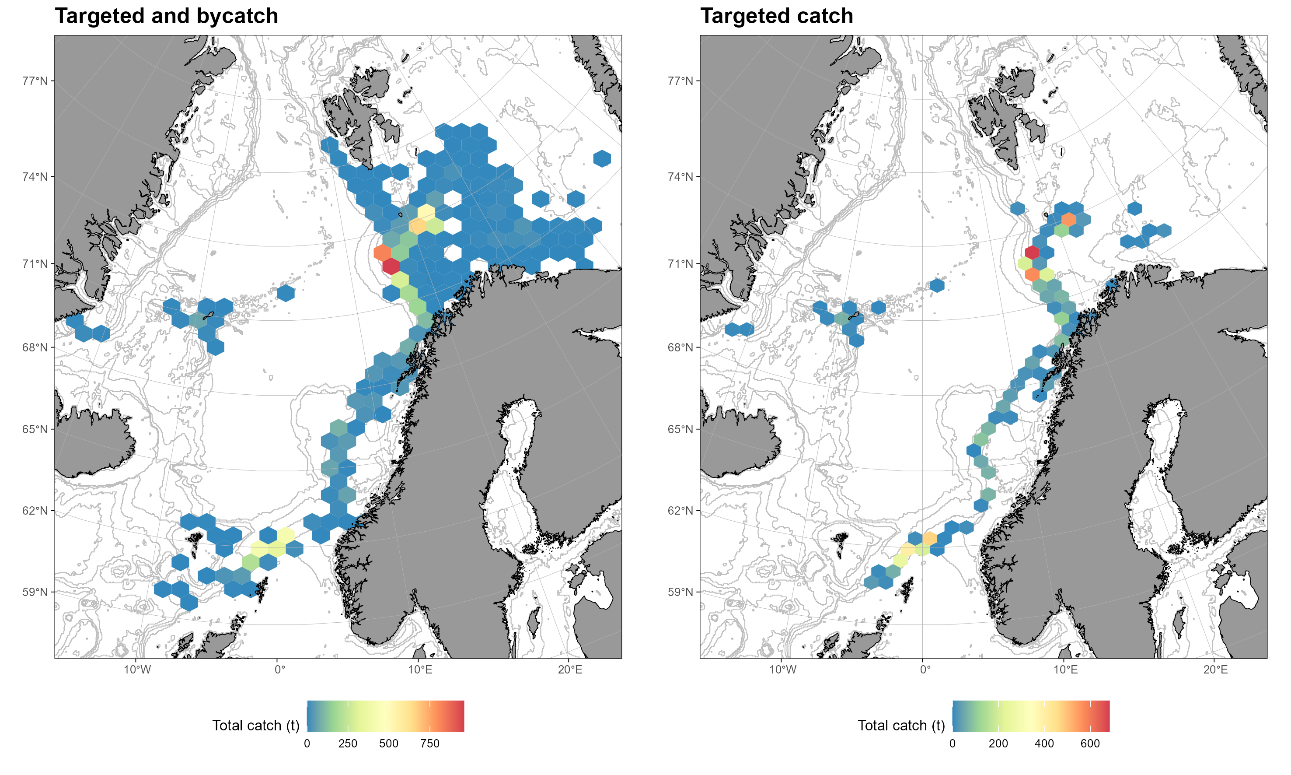
Figure 8.2. Spatial distribution of Greenland halibut catches in 2024 according to Norwegian electronic logbooks, in all registered fisheries including bycatch (A), and catches where Greenland halibut make more than 50% of the total catches (B).