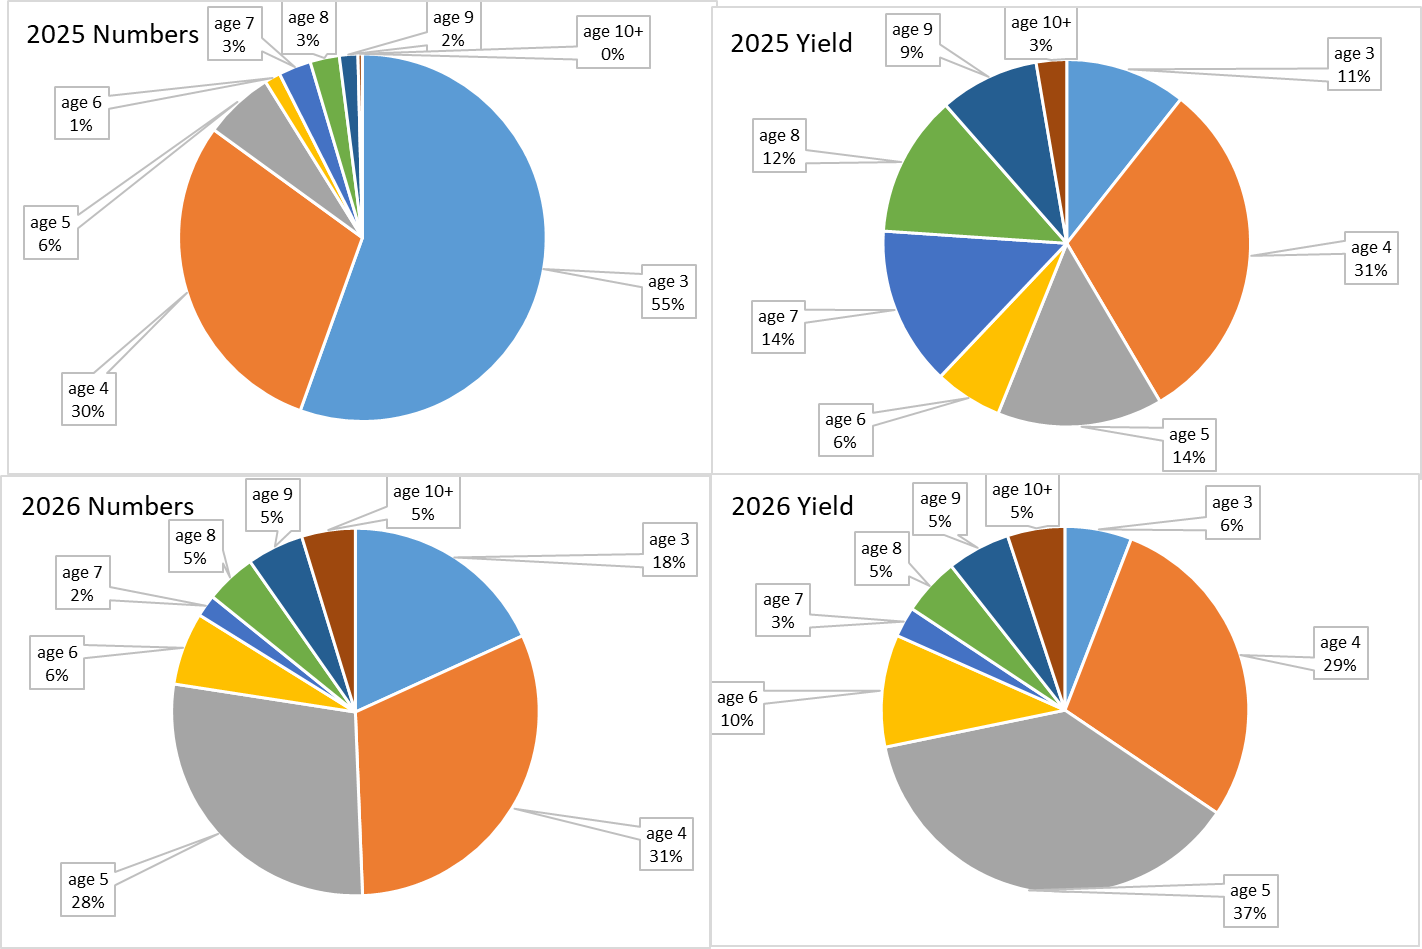
Figure 4.8 Top left: proportion of the stock (number of individuals) by age in 2025, output from SAM (Table 4.13). Top right: proportion of yield in biomass by age forecasted for 2025, using TAC constraint for 2025, taken from Table 4.20. Bottom left: proportion of the stock (number of individuals) by age in 2026, taken from Table 4.20. Bottom right: proportion of yield in biomass by age forecasted for 2026 applying Fbar=0.35, taken from Table 4.20.