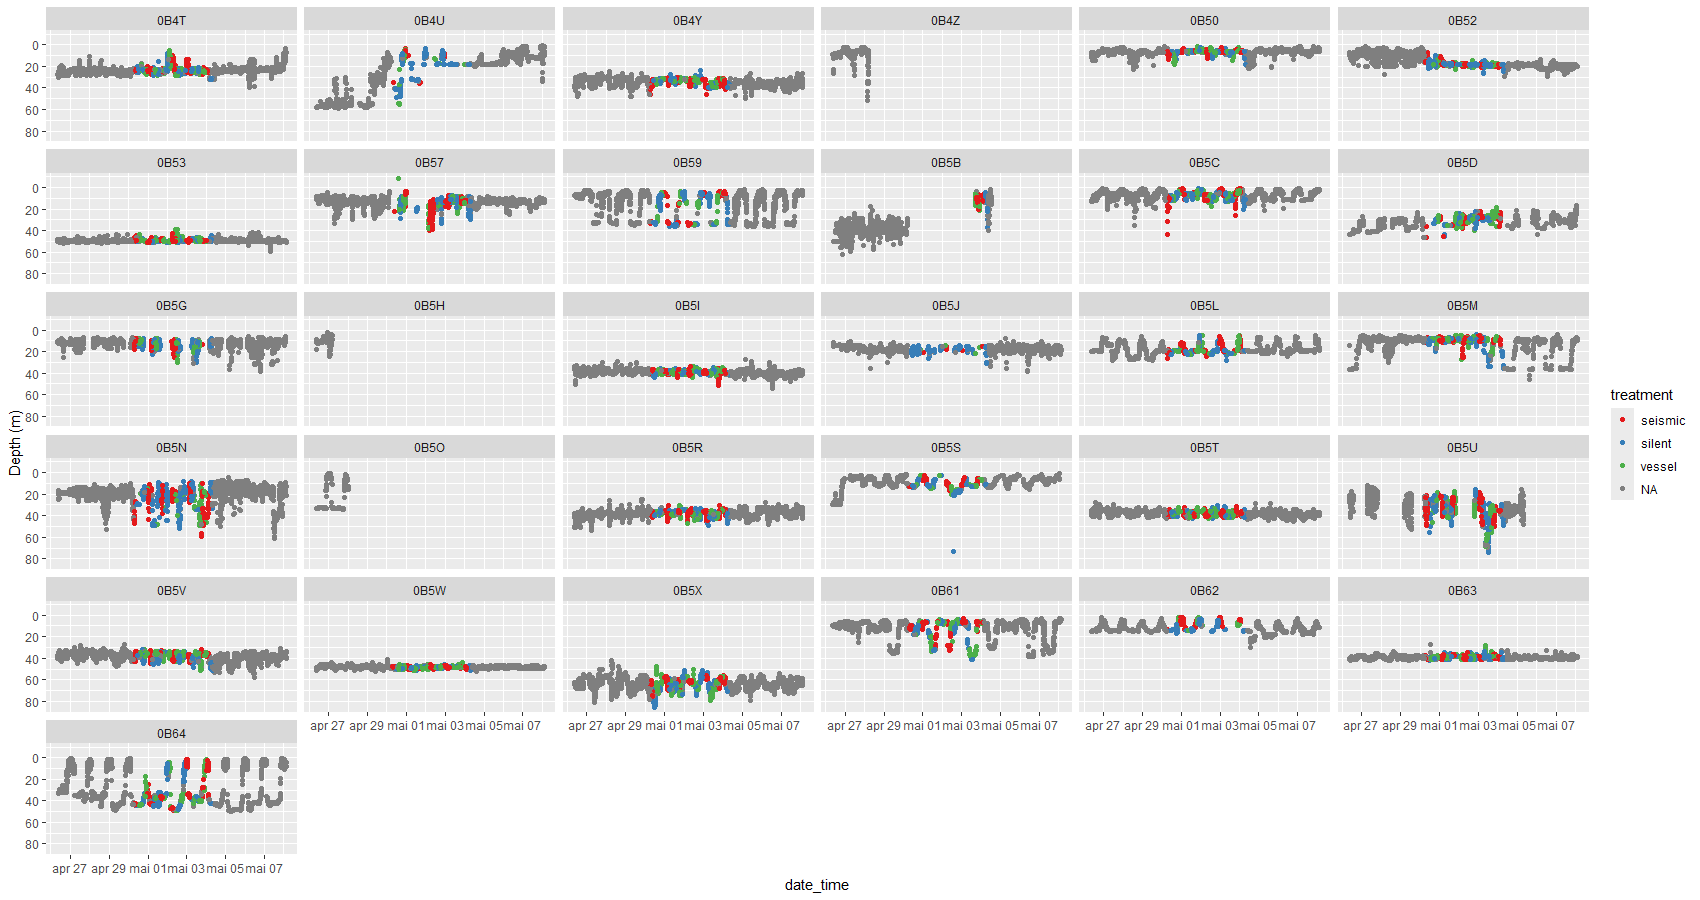
Figure 21. Swimming depth of individual fish present in the grid in the period comprising 4 days before, 4 days during and/or 4 days after the exposure survey. Grey dots are before/after the survey, coloured dots are the survey period, with different colours indicating the different treatments; seismic (red), vessel (green) and silent (blue).