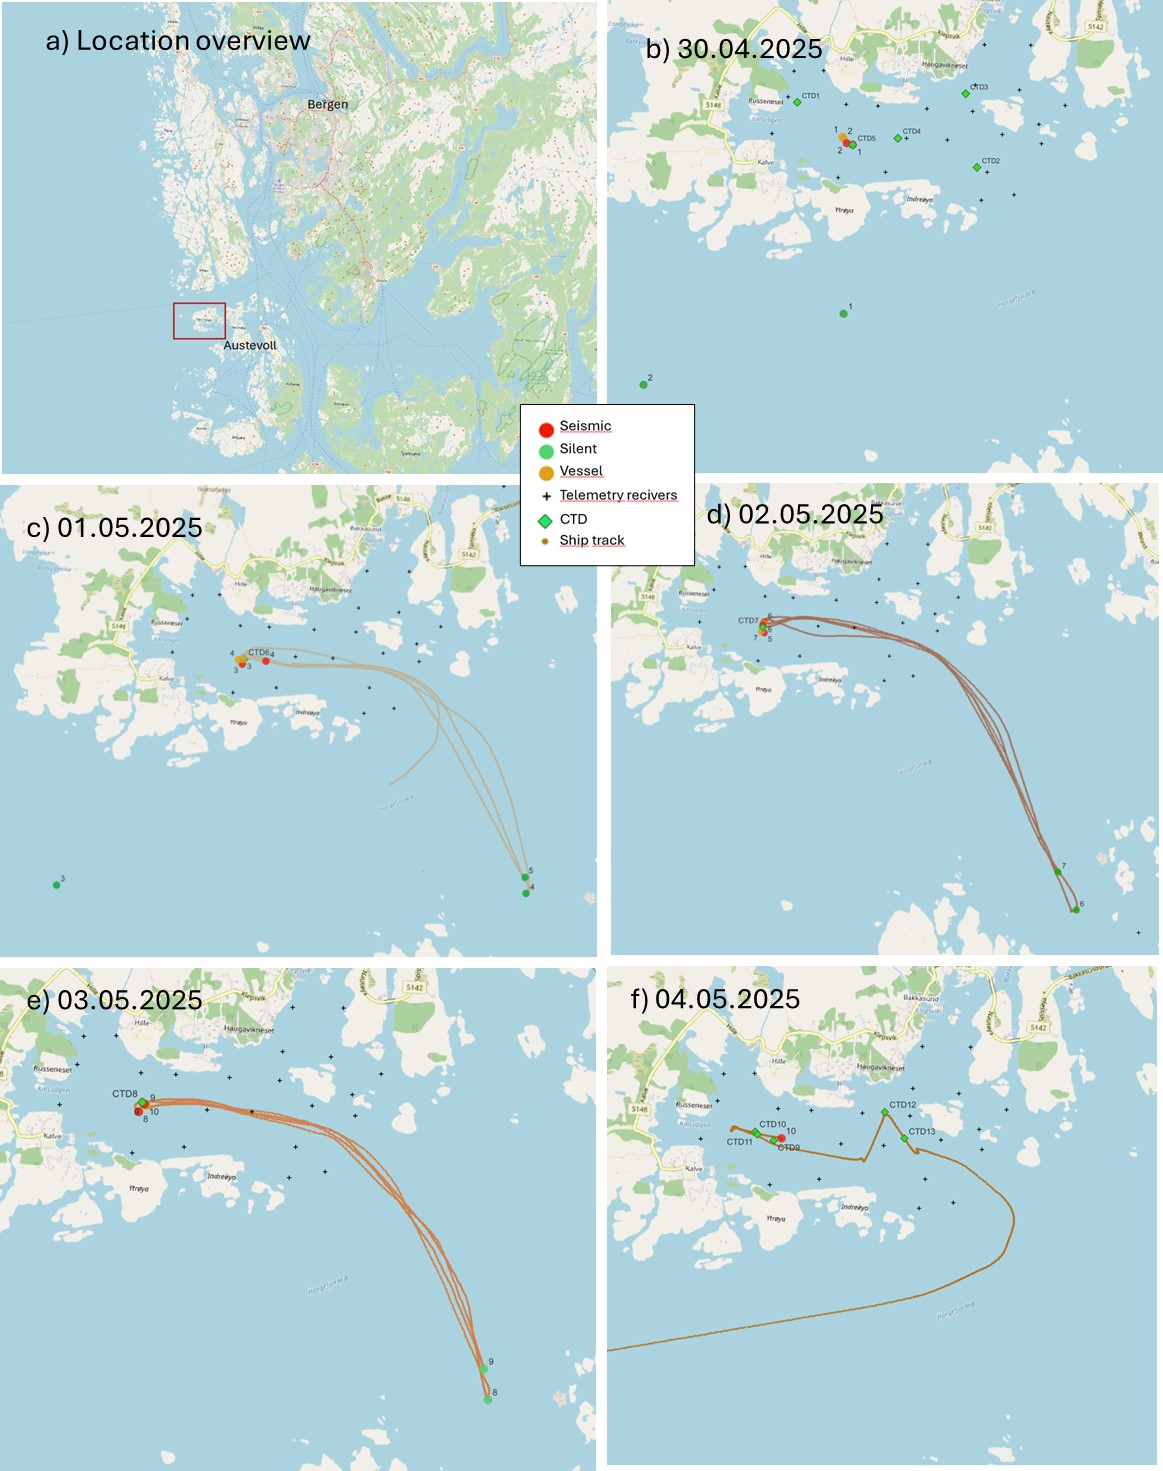
Figure 8. Map of daily activity for each of the survey days 30.April- 4.May 2025. a) show an overview of the location, with the red square indicating Bakkasund, the area within this square are the area shown in maps b-f. Position of vessel during all 3 treatments of those blocks conducted the day specified as red, orange and green dots for seismic, vessel control and silent control, respectively, with numbers next to them indicating the block number, as given in Table 3 . The ships track is shown in brown, and CTD stations marked as green diamonds. CTD names refer to those given in Table 4 . Ship track for 30.April and some parts of 1.May is missing.