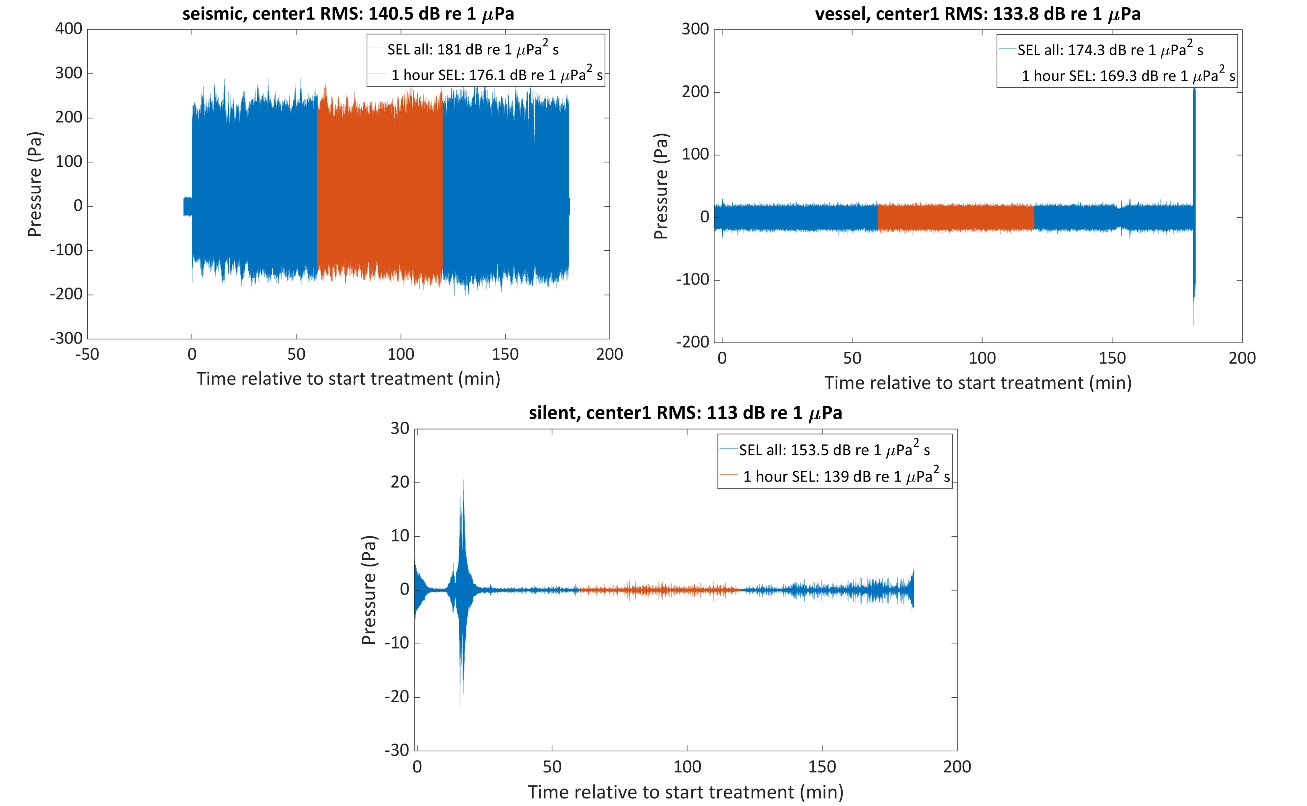
Figure 16. Example of the waveform of the recording for 3 hours of data for the three exposure types. The SEL for 1 hour (in the centre of the treatment marked in orange) is 176.1 dB re 1 µPa2s and 181 dB re 1 µPa2s for 3 hours of seismic exposure measured in the centre of the bay for Block 5.