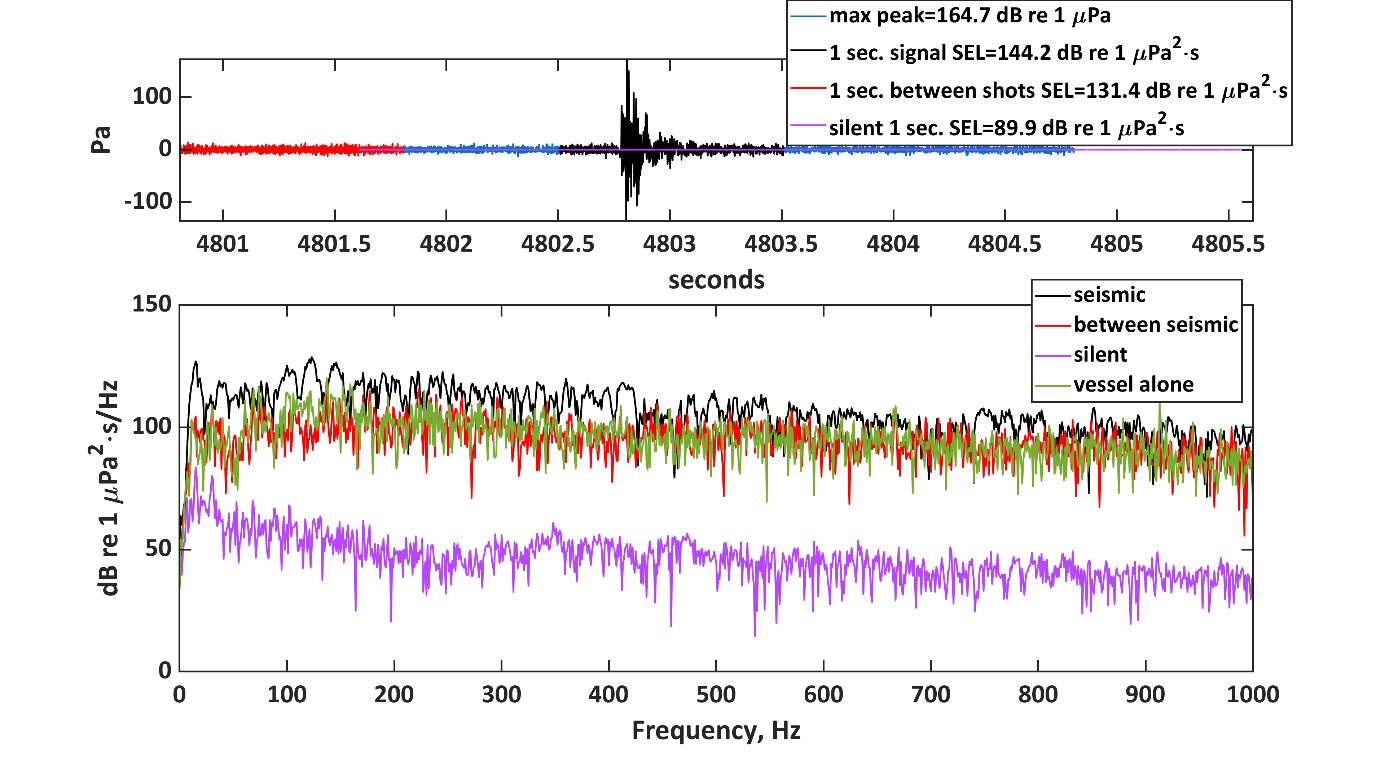
Figure 12. Example of a single seismic signal measured with the IcListen hydrophone in the centre of the bay. Zero to peak, SEL for the sigle shot, and SEL for a 1 second duration period before the shot is compared to the silent treatment (see figure legend). In the bottom panel the frequency content of the seismic signal (black1) relative to the period before (red), vessel noise alone (green), and silent with no vessel (purple) is shown. Most of the energy from the seismic is below 450 Hz with the highest levels between 100 – 150 Hz. The signal from the vessel dominates between the seismic signals. The signal from the vessel and vessel + seismic has much higher level than the silent for all measured frequencies, (up to over 20000 Hz). The broadband noise above 500 Hz is probably dominated by the vessel noise since the vessel noise alone shows a similar level.