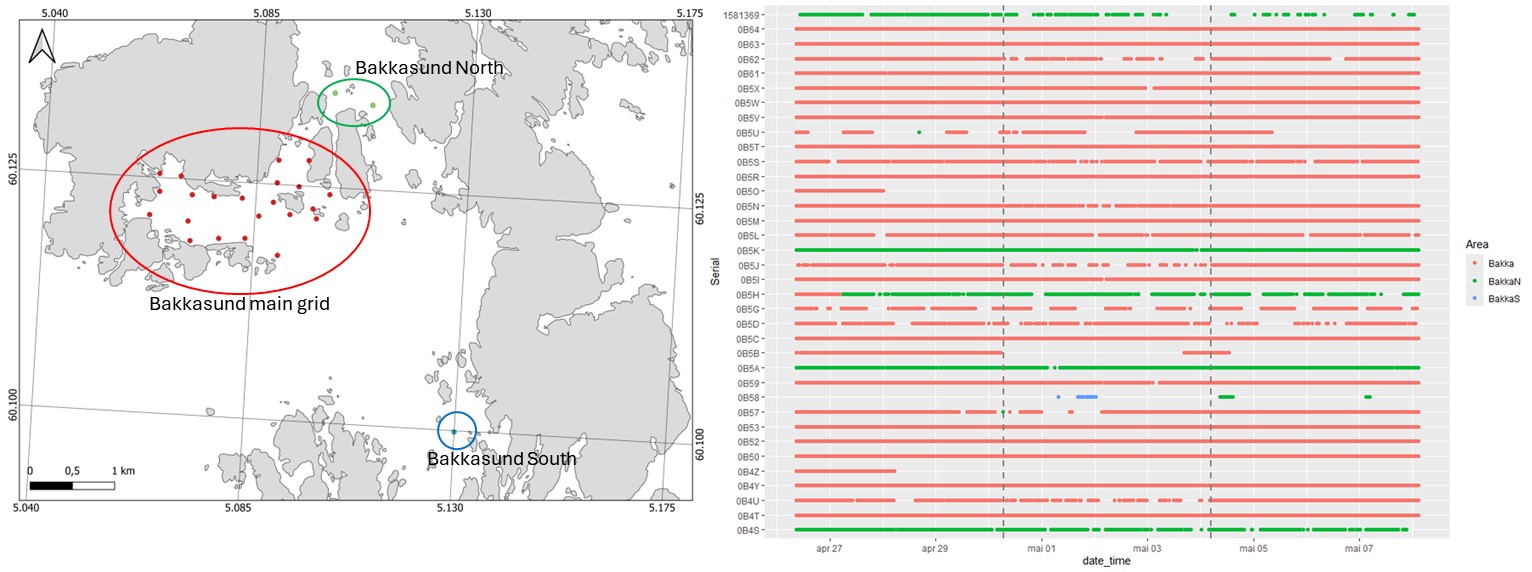
Figure 20. Map on the left shows the receivers downloaded in September 2025; from the main Bakkasund grid (red dots), the receivers in the north (green dots) and in the south (blue dot). Right plot show the detections of individual fish in a period 4 days before, 4 days during and 4 days after the survey, with. grey vertical dashed lines showing the survey period. The colours correspond to the areas in the map. Each row is a different tag ID, with