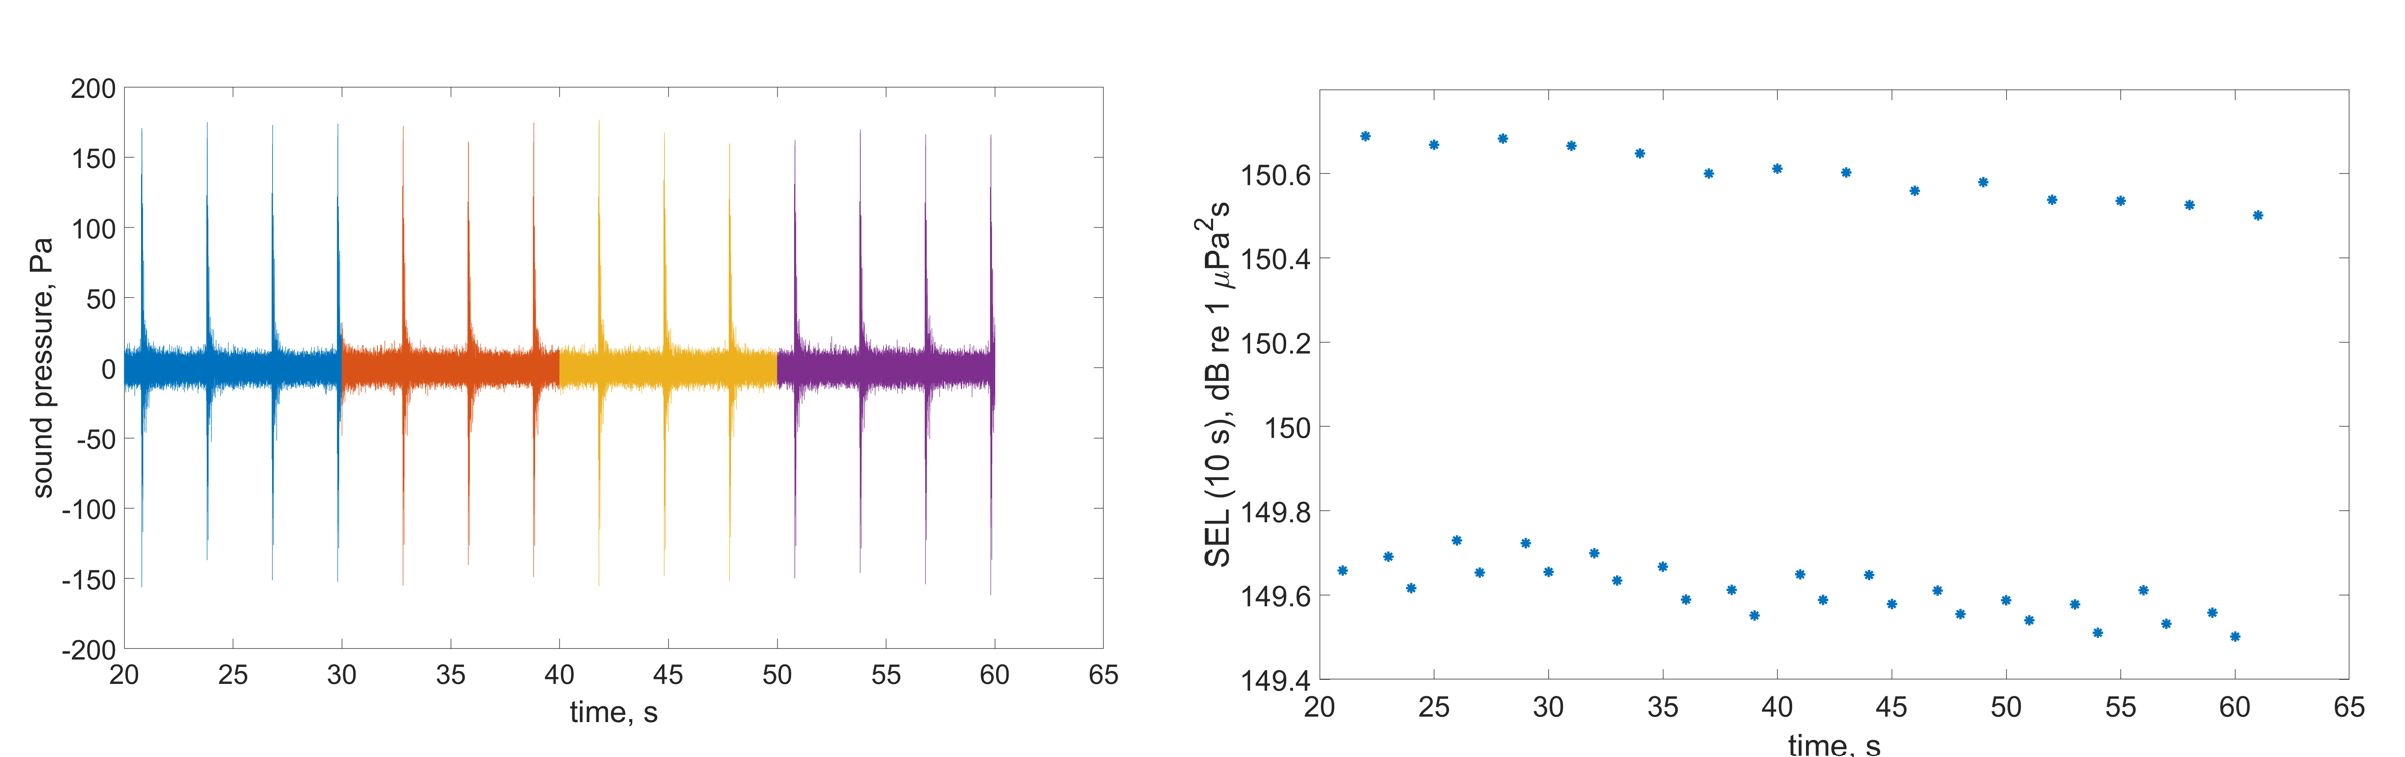
Figure 13. Zoom in on about 40 seconds of sound recording from the centre position. The different colours (left) marks 10 seconds intervals to illustrate that the pulse interval of 3 seconds results in 3 or 4 single seismic pulses pr 10 seconds. The SEL integrated over 10 seconds is affected by the the number of pulses resulting in about 1 dB difference if 3 or 4 pulses is included (right)