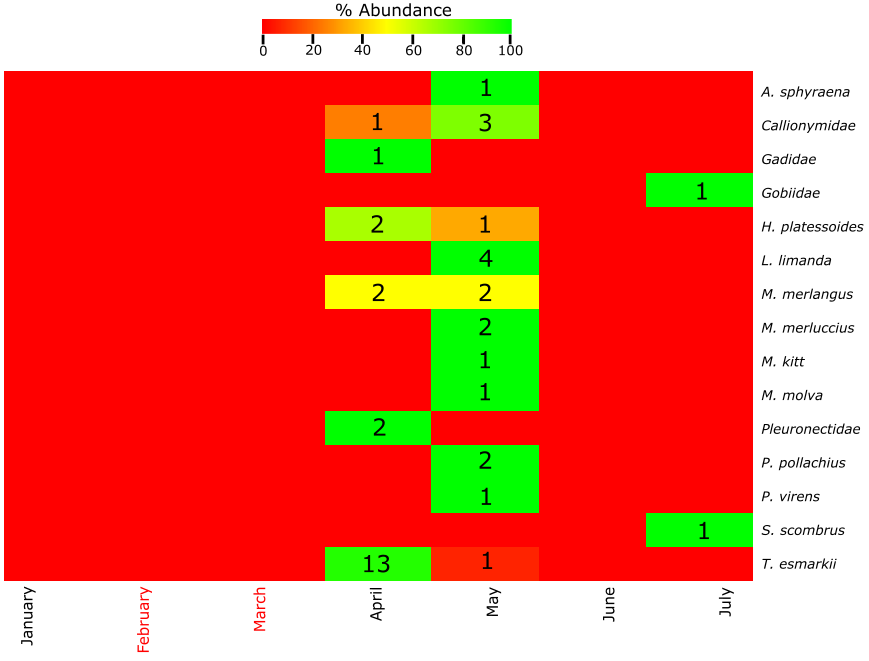
Figure A4.
Heatmap of the % abundance of the fish larvae found at Tampen from
the taxonomic approach. The total number of individuals from each
species per month of the year is indicated with a number within the
figure. Months with no samples collected are indicated with red
color. Months between October
and December are not included due to the absence of larvae in the
samples.