Figure
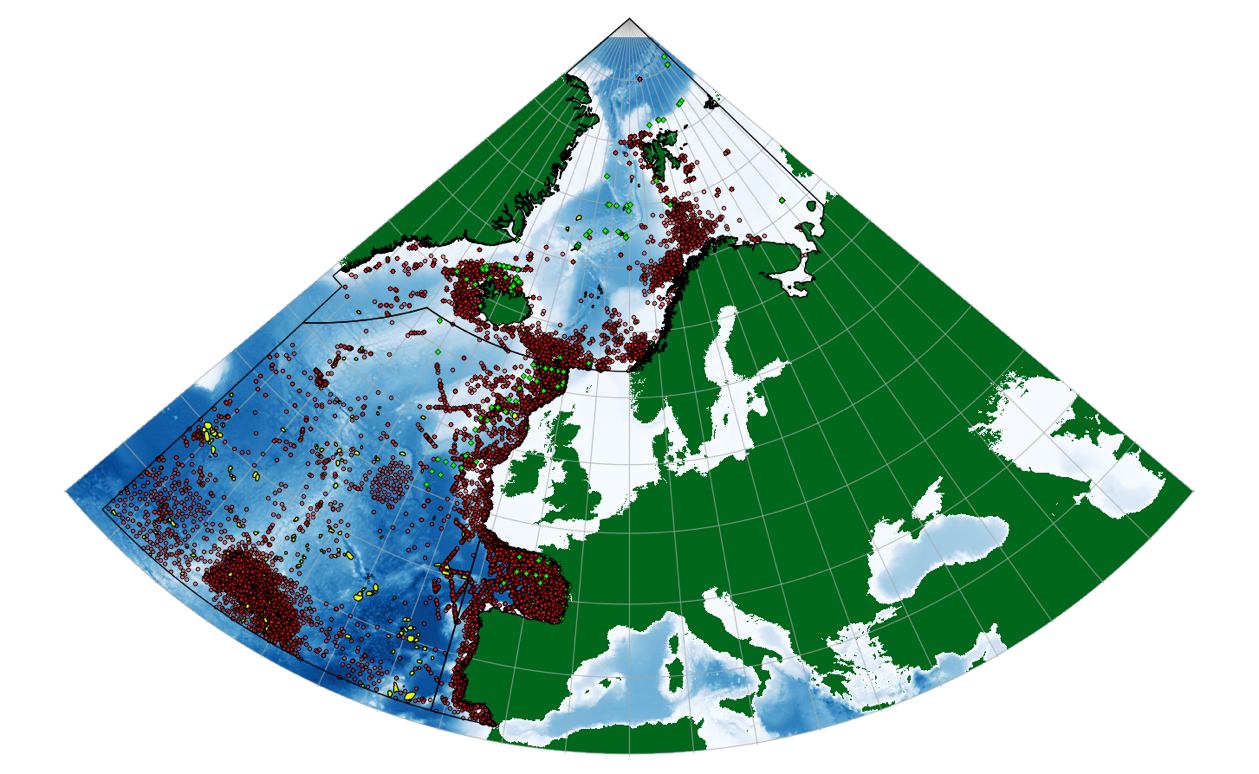
5. Modelled seamounts within the OSPAR region (yellow), and all
marine mammal sightings available for this region through the Ocean
Biogeographic Information System (OBIS). Whale observations are
represented by red dots, while seal sightings are indicated by green
diamonds.