Figure
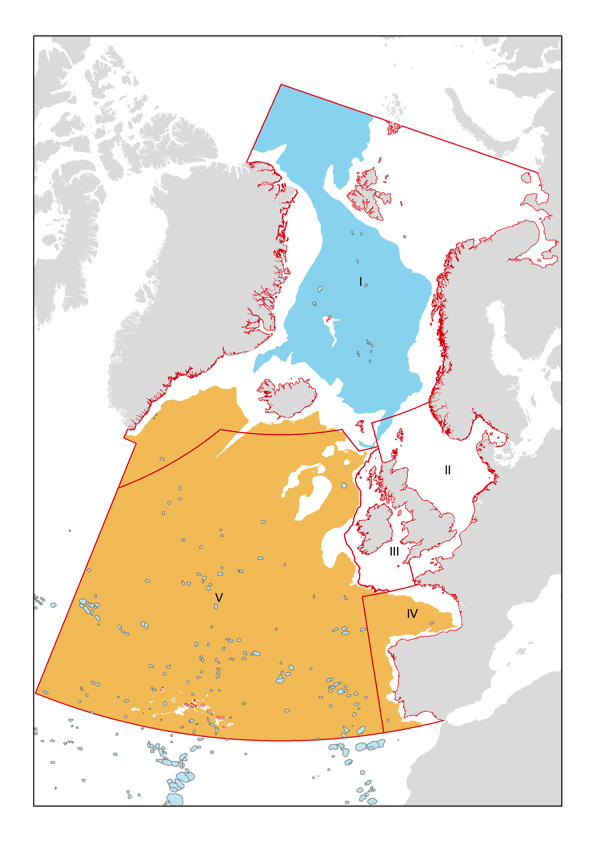
1. Map showing the extent of the OSPAR maritime area that comprises a
total of 5 regions (Region I, II, III, IV and V), of which Regions I,
IV and V have significant deep-sea areas. The orange and blue patches
represent the Atlantic and Arctic deep-sea biogeographic zones after
Dinter (2001), and blue-grey dots and small patches are seamounts, as
predicted by Harris et al. (2014).