Figure
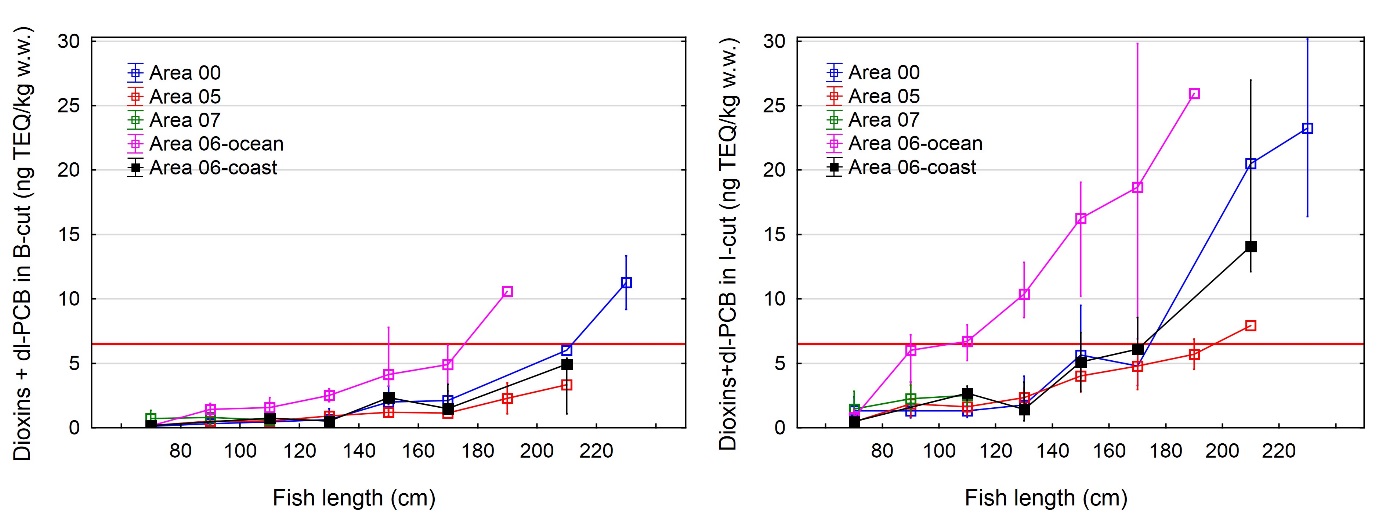
7. Concentration of sum PCDD/F+dl-PCB in B-cut (left) and I-cut
(right) of Atlantic halibut from different
areas within Norwegian waters (see figure 1 for geographical location
of the different areas), at different
fish length intervals (<80, 80-100,
100-120, 120-140, 140-160, 160-180, 180-200, 200-220 and >220 cm).
The red horizontal line indicates the EU and Norwegian maximum level
for sum PCDD/F+dl-PCB in fish muscle (6.5 ng TEQ/kg w.w.). Medians ±
25-75% percentiles are shown.