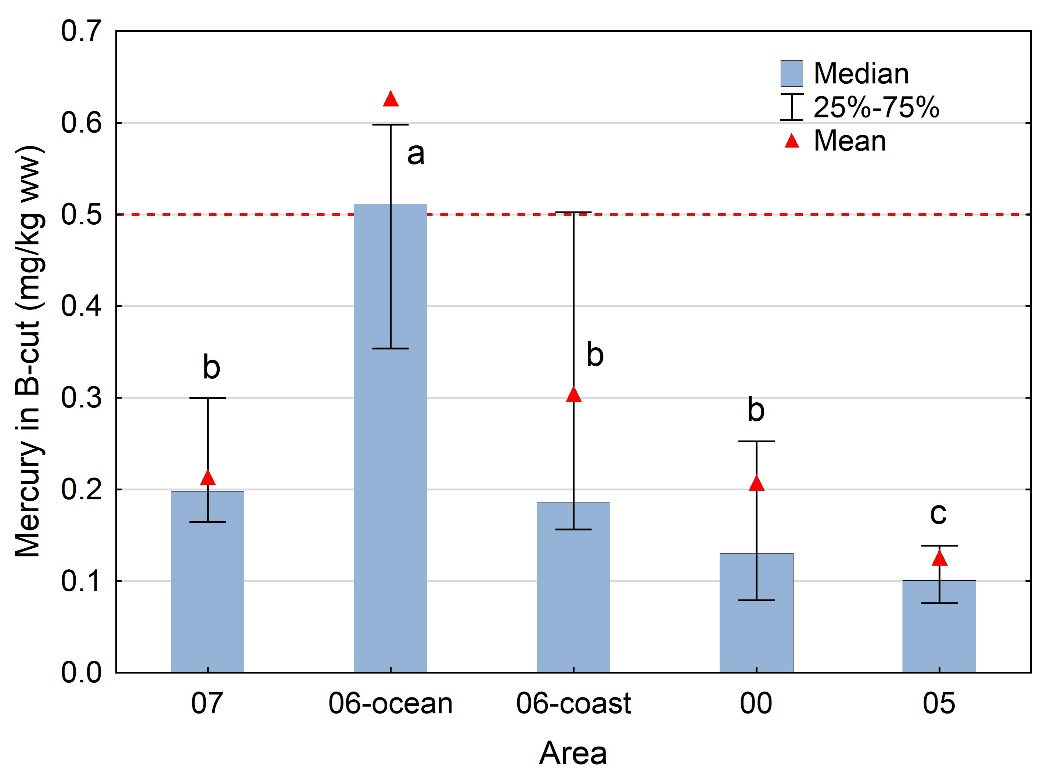
Figure
4. Concentrations of mercury in B-cut of muscle from Atlantic halibut
sampled in different areas within Norwegian waters (see figure 1 for
geographical location of the different areas). Median
concentrations (columns) and 25 and 75 percentiles (vertical bars)
are shown for each area. Mean values are indicated by red triangles.
The maximum level for mercury in muscle meat from Atlantic halibut,
1,0 mg/kg wet weight, is outside the scaling of the figure. The red
dotted line indicates the EU and Norwegian maximum level for mercury
in muscle meat from most other fish. Different
letters above the columns indicate significant differences between
the areas (one-way ANOVA with log-transformed mercury values,
followed by Tukey post-hoc test, p<0.05)