Figure
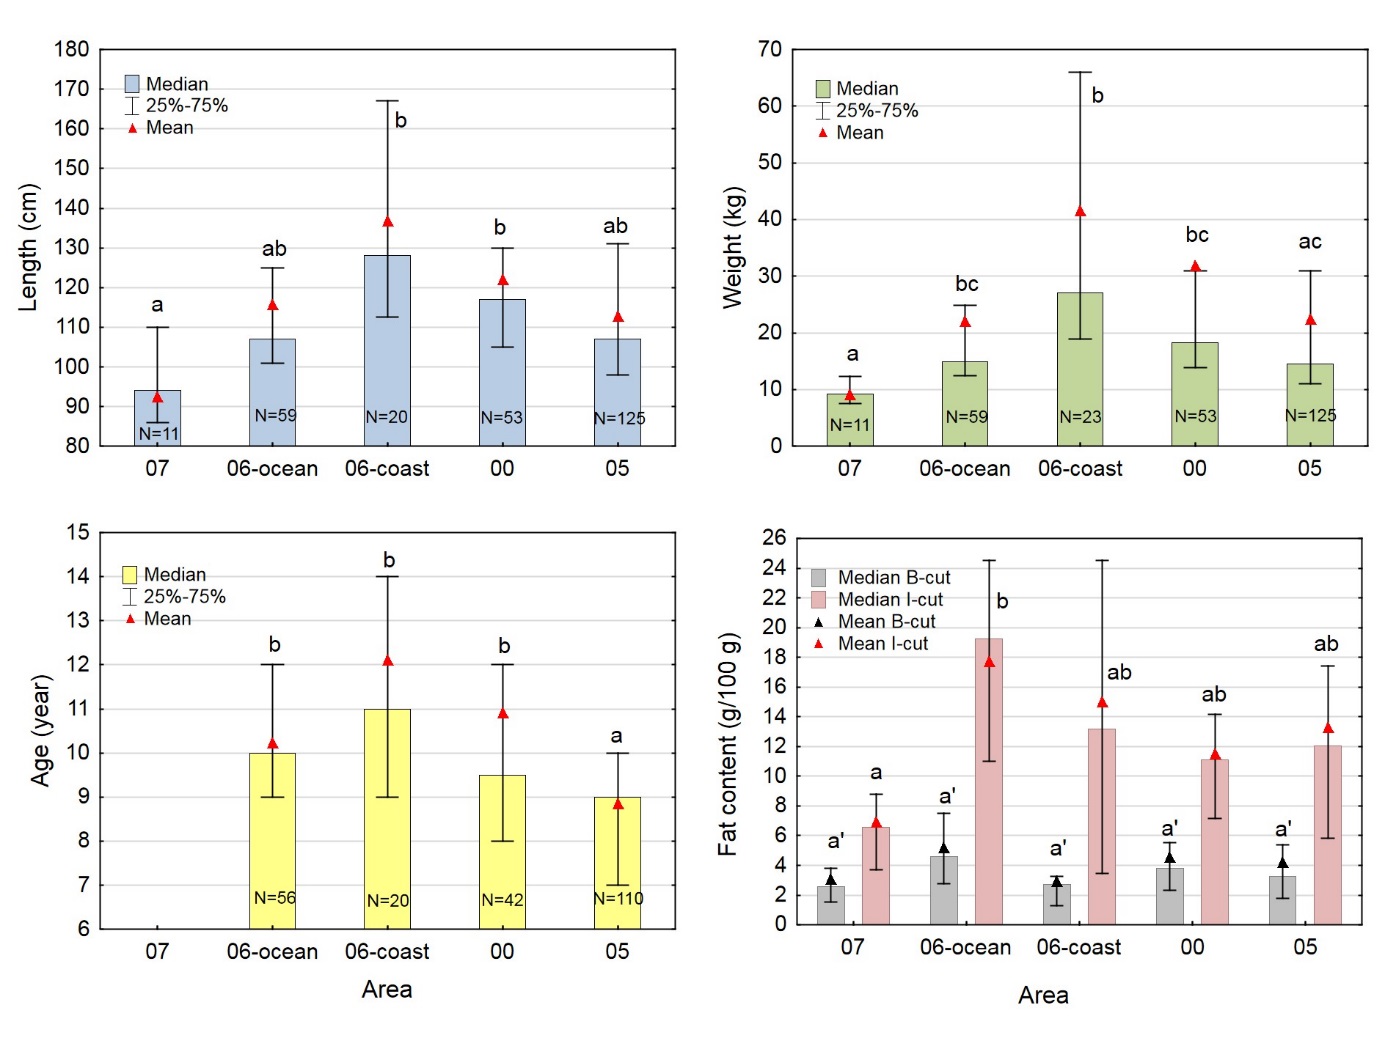
3. Length, weight, age and fat content in B-cut and I-cut of the
fillet from Atlantic halibut collected in
different areas within Norwegian waters (see figure 1 for
geographical location of the different areas). Age
was not determined for halibut from area 07. Median concentrations
(columns), 25 and 75 percentiles (vertical bars), and mean values
(red and black triangles) are shown. Data for halibut from areas 07,
06-ocean, 00 and 05 are from an earlier study (Nilsen et al., 2016)
and are included here for comparison. Different
letters above the columns indicate significant differences between
the areas (one-way ANOVA with log-transformed values, followed by
Tukey post-hoc test, p<0.05)