Figure
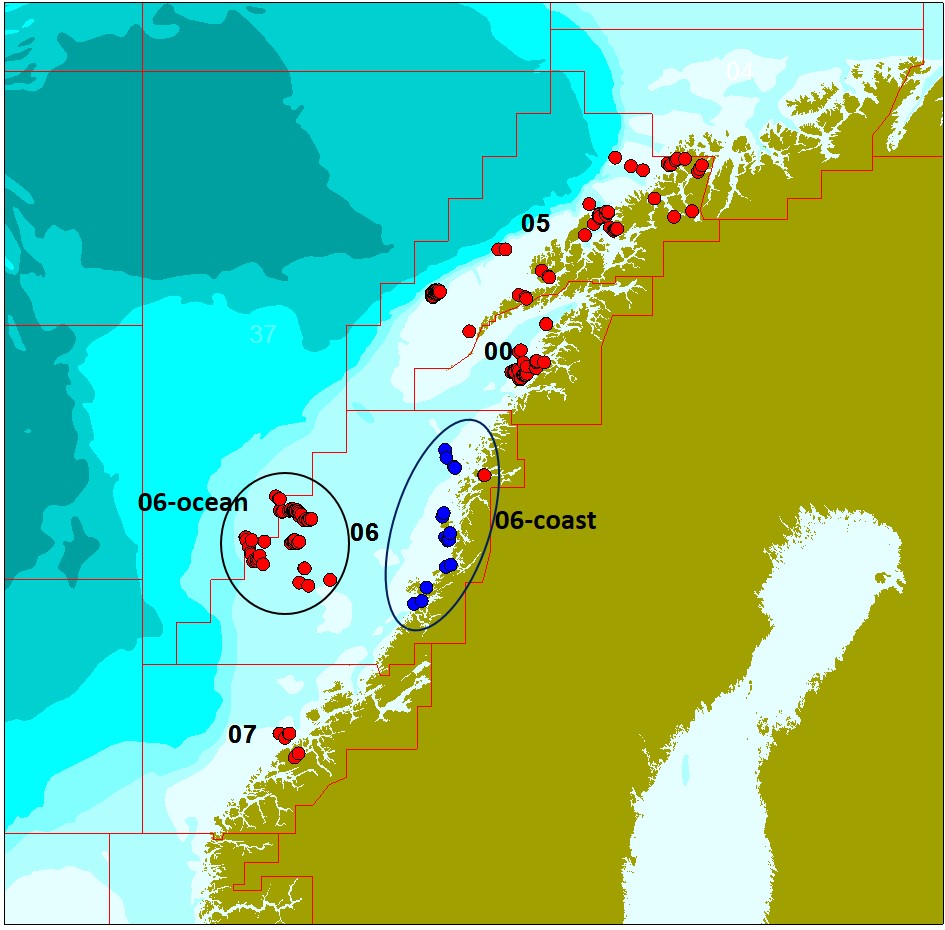
1. Map showing all positions where
individual Atlantic halibut were sampled in this study (blue points)
and in an earlier study included here for comparison (red points;
Nilsen et al. 2016). The numbers indicate the statistical areas used
by the Norwegian Directorate of fisheries (areas delineated with red
lines). Atlantic halibut sampled within area 06 were grouped into two
groups, 06-coast and 06-ocean.