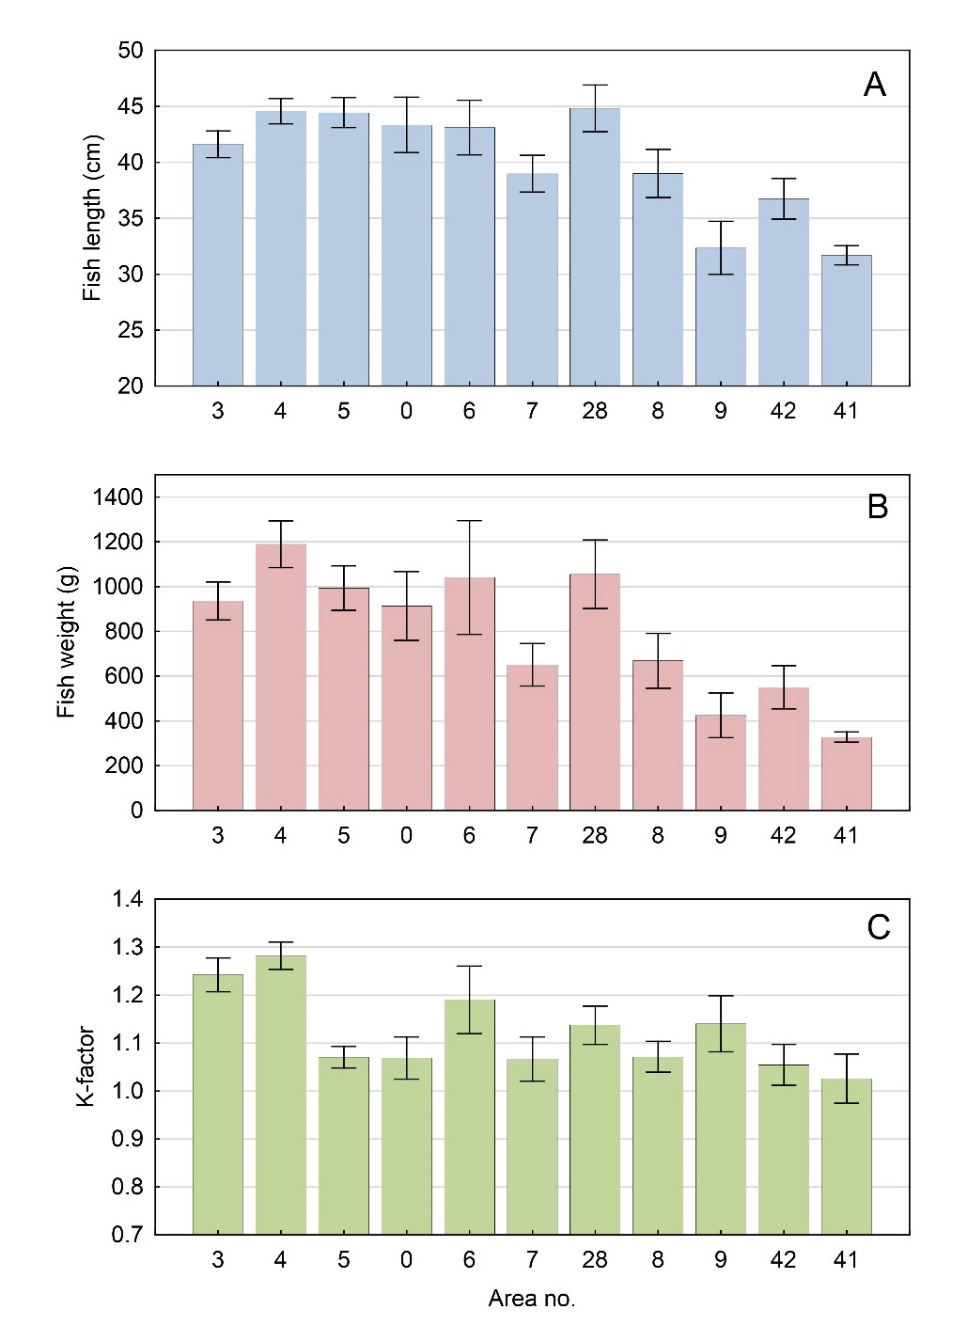
Figure
4 A) Fish length (cm), B) weight (g) and C)
k-factor (K = weight/length 3 )
of plaice ( Pleuronectes
platessa ) sampled in different
areas (statistics areas) of the Norwegian coast (from north to south:
areas 03 to 09) and the North Sea (areas 41 and 42). Mean
± 95% confidence intervals are given.