Figure
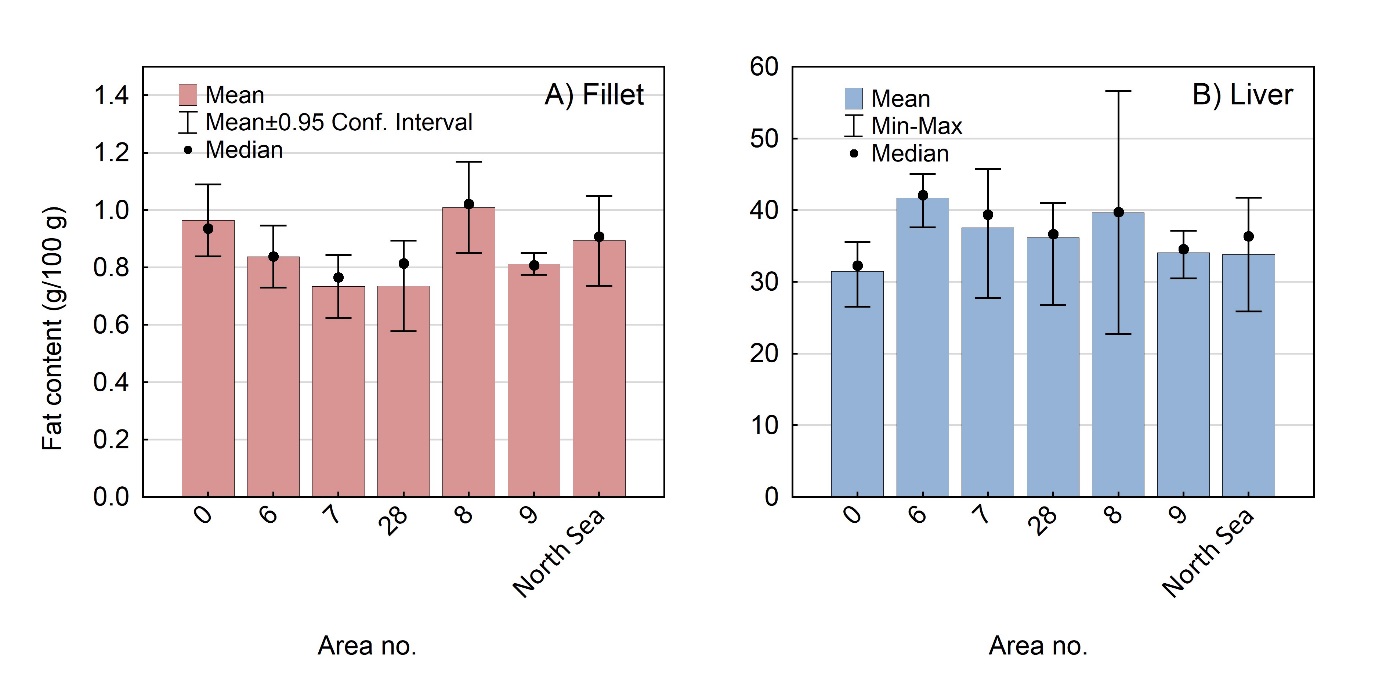
20 Fat contents (g/100 g) in A) fillet and
B) liver of anglerfish ( Lophius
piscatorius ) sampled in different
areas (statistics areas) of the Norwegian coast (from north to south:
area no. 00 to 09) and the North Sea. Mean (bars), median (black
dots), minimum and maximum values (error bars) are given.