Figure
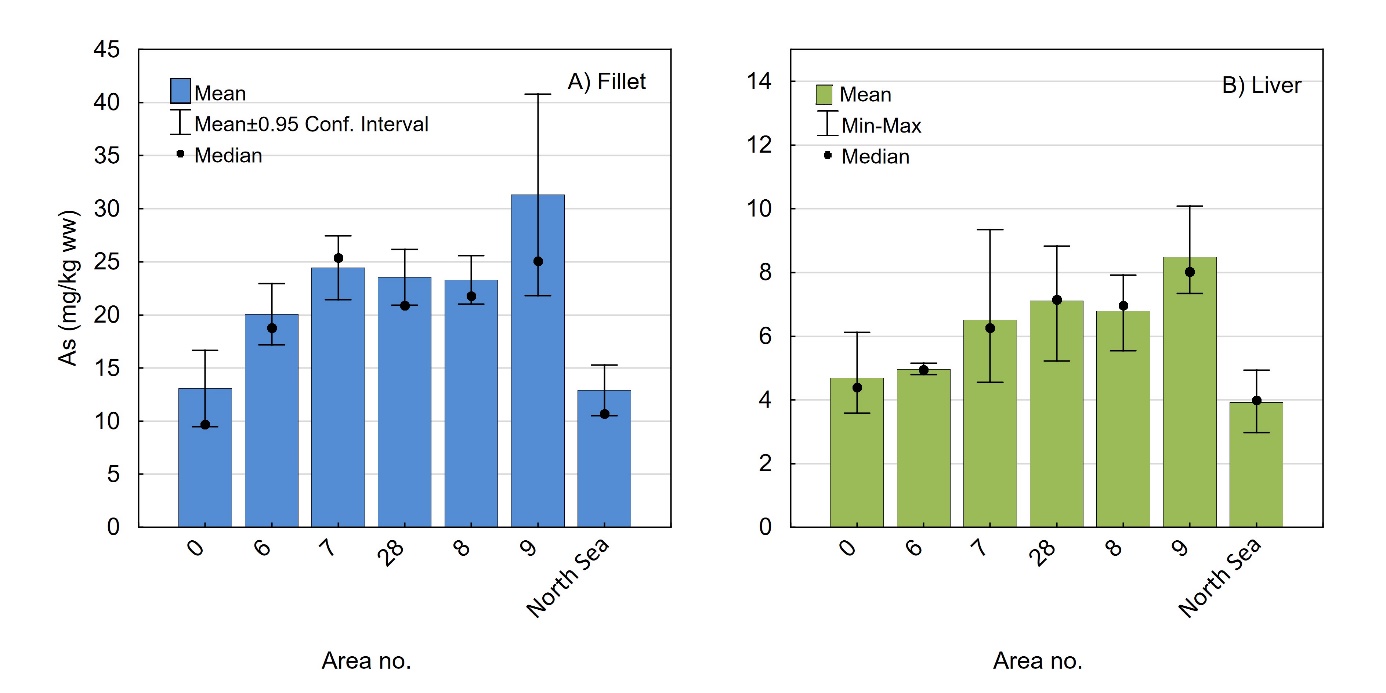
25 Variation in As concentration (mg/kg wet
weight) in A) fillet and B) liver of anglerfish ( Lophius
piscatorius ) sampled in different
areas along the Norwegian coast (from north to south: area no. 00 to
09) and in the North Sea. For fillet, mean ± 95% confidence interval
and median values are given. For liver, mean, minimum, maximum and
median values are shown.