Figure
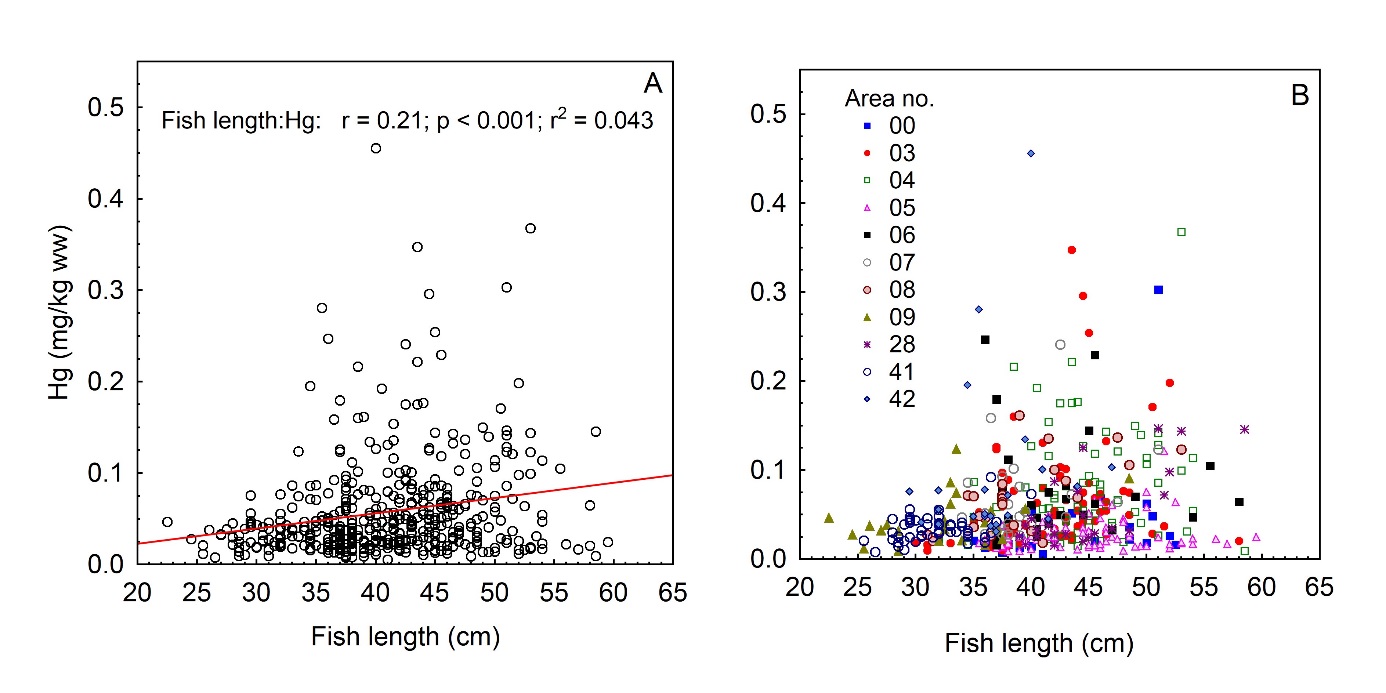
9 Scatterplots of Hg concentration (mg/kg
wet weight) in fillet of plaice ( Pleuronectes
platessa ) versus fish length
(cm). A) The whole dataset, giving the result of Pearson’s linear
correlation between Hg and fish length. B) Categorised by statistics
area, where different colours mark different areas as shown.