Figure
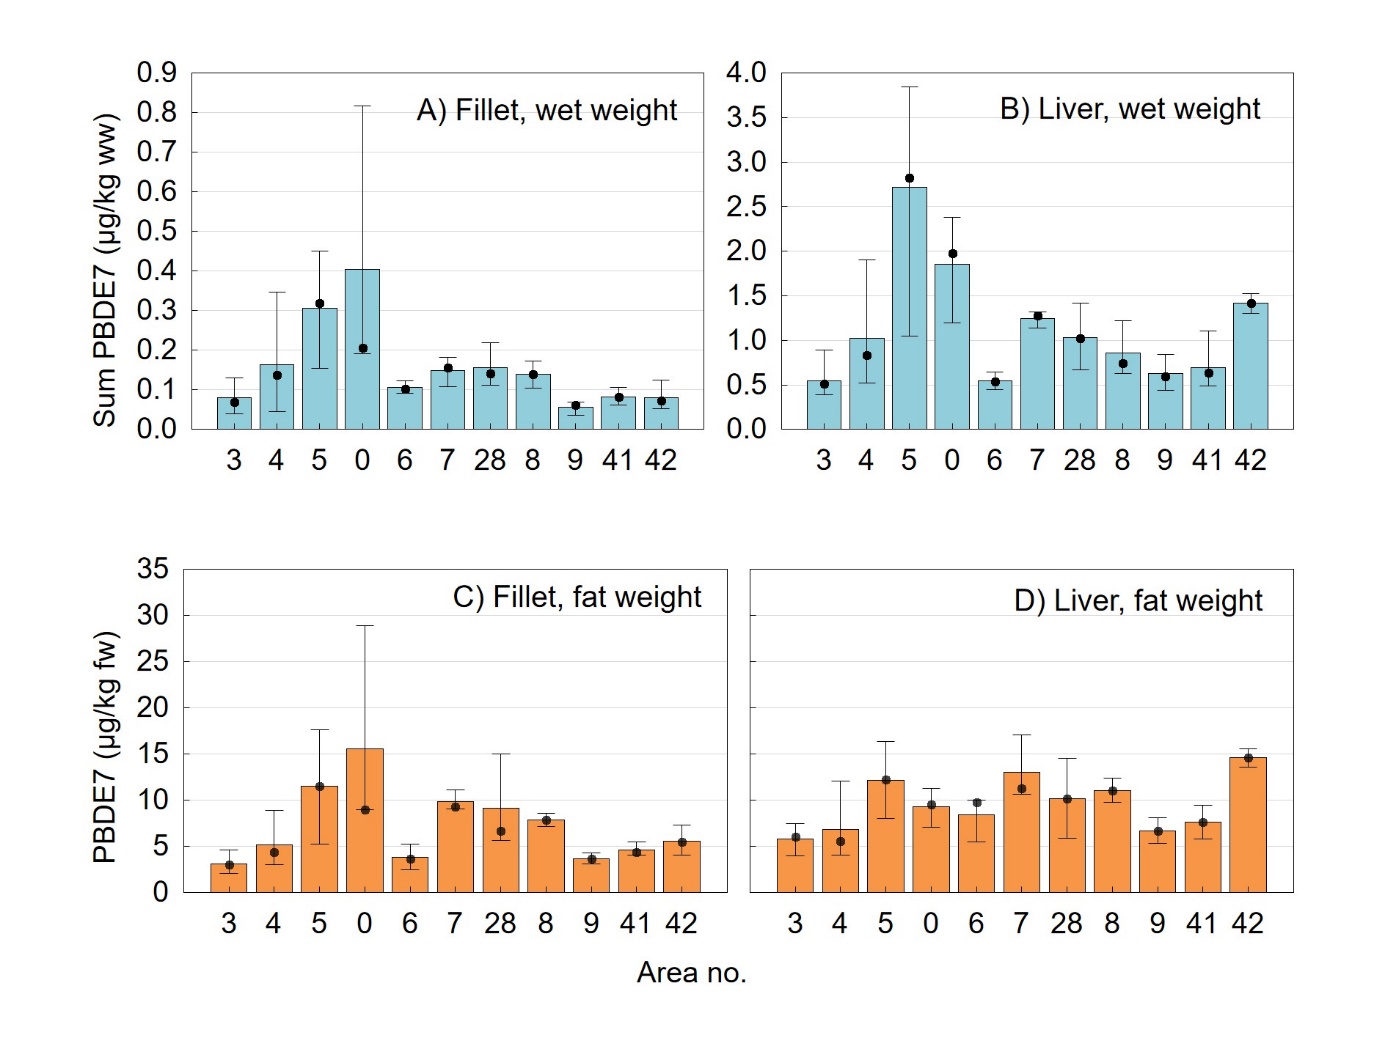
17 Concentrations (µg/kg lipid weight) of
Sum PBDE7 (Sum of PBDE-28, 47, 99, 100, 153, 154 and 183) (µg/kg) in
A,C) composite fillet samples and B,D) composite liver samples from
plaice ( Pleuronectes
platessa ) sampled in different
statistics areas (Area no.) along the Norwegian coast (from north to
south: areas 03 to 09) and in the North Sea (areas 41 and 42).
Results are given on wet weight (ww) and fat weight (fw) basis. Mean
(bars), median (black dots), minimum and maximum values are given.
Please note that in A and B, the y-axes are different, while in C and
D, the y-axes are the same.