Gå til hovedinnhold
Havforskningsinstituttet
HI
English
<- Tilbake
Søk
Søk
Søk
View page in English
Figur
Fra rapporten:
Fremmedstoffer i rødspette, breiflabb og lyr
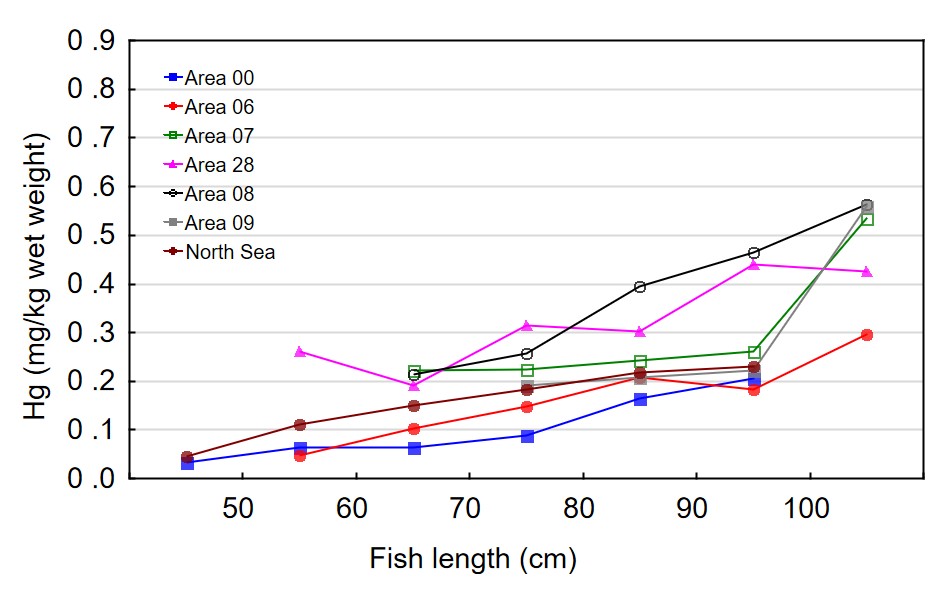
Figure 23 . Mercury concentration in fillet of anglerfish ( Lophius piscatorius ) in different fish length intervals and categorised by statistics area. The different areas are given different colours and symbols. Mean values are shown.