Figure
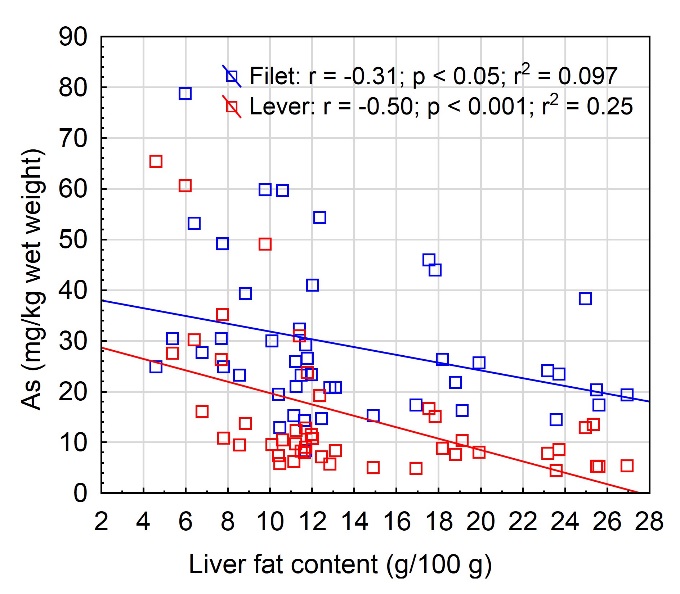
13 . Correlation between arsenic
concentrations in fillet and liver (As, mg/kg wet weigth) and fat
content (g/100 g) of the liver. Liver fat content and As
concentrations in liver (red) were measured in composite samples. For
fillet, mean As concentrations (blue) were calculated for the fish
that were pooled for the liver fat analysis. Result of
Peason’s linear correlation analysis is shown.