Figure
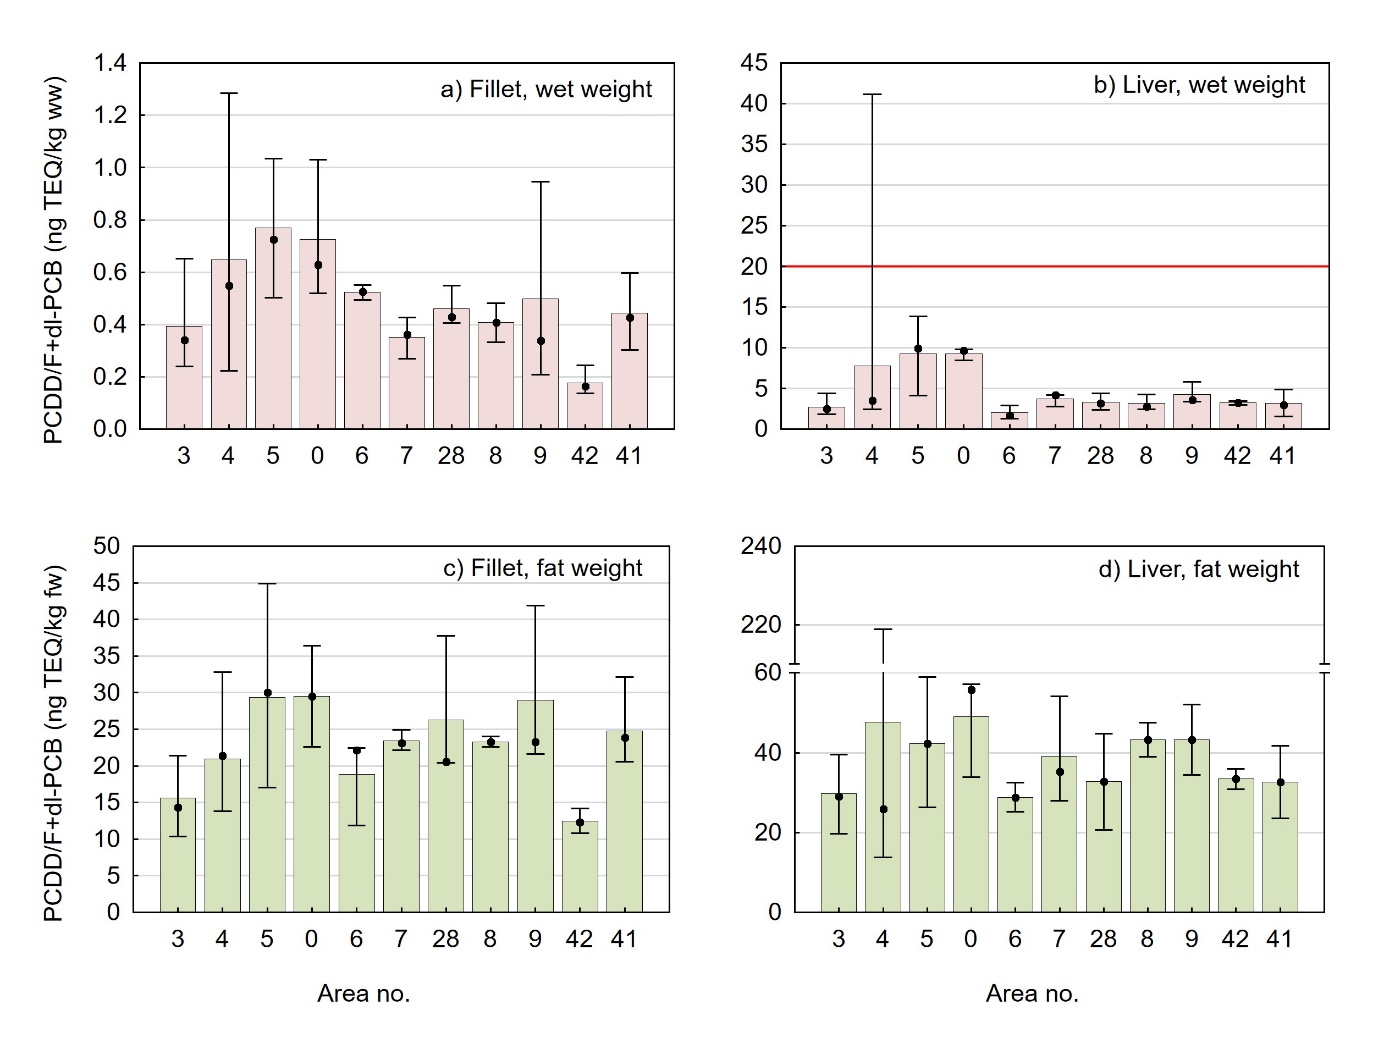
16 . Concentrations of sum dioxins and
dioxin-like PCB (PCDD/F+dl-PCB) in plaice (Pleuronectes platessa)
from different fisheries statistics area along the Norwegian coast
(from north to south: areas 03 to 09) and in the North Sea (areas 41
and 42). Concentrations are given in A) fillet samples on wet weight
basis (ww), B) liver samples on wet weight basis (ww), C) fillet
samples on fat weight basis (fw) and D) liver samples on fat weight
basis (fw). Columns and error bars indicate mean, minimum and maximum
values, and black dots mark median values. The red line in B)
indicate the EU and Norway’s maximum level applying to liver.