Figure
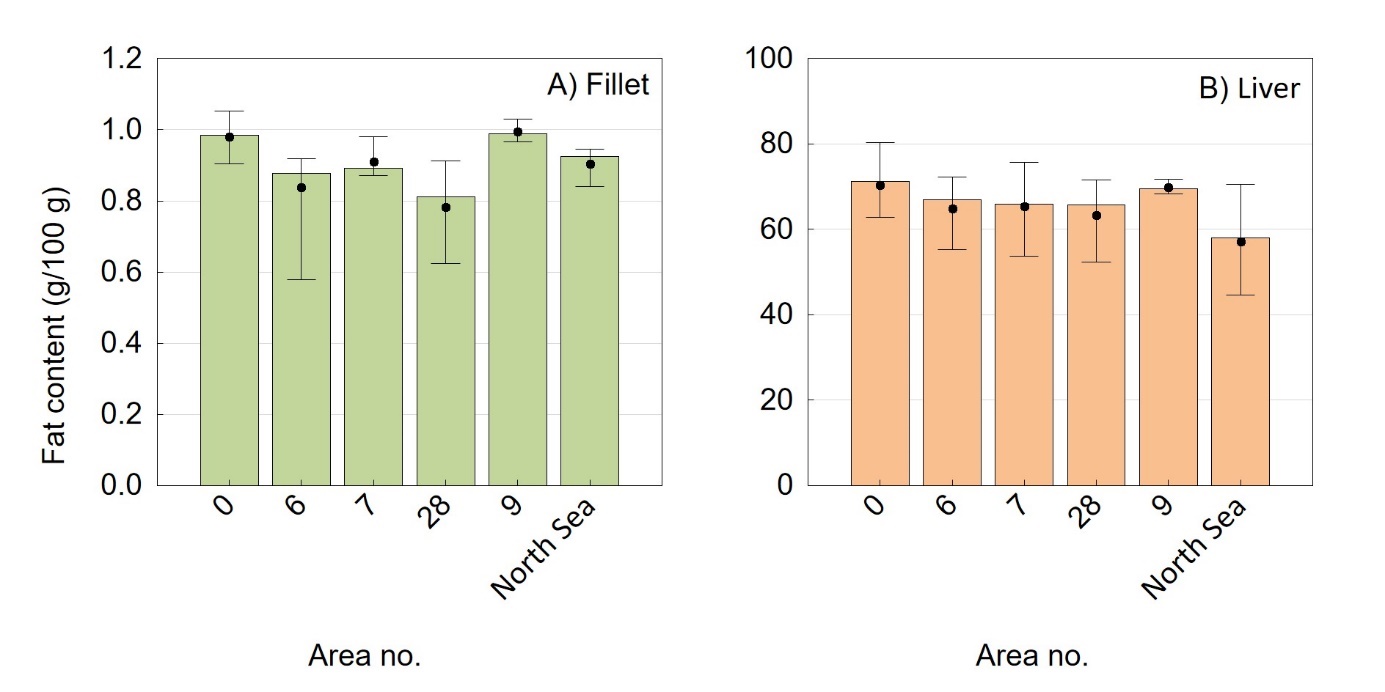
33 . Fat content (g/100 g) in composite
samples of A) fillet and B) liver of pollack ( Pollachius
pollachius) sampled in different
areas of the Norwegian coast (from north to south; area 00 to 09) and
in the North Sea. Mean, minimum, maximum and median values are
given.