Figure
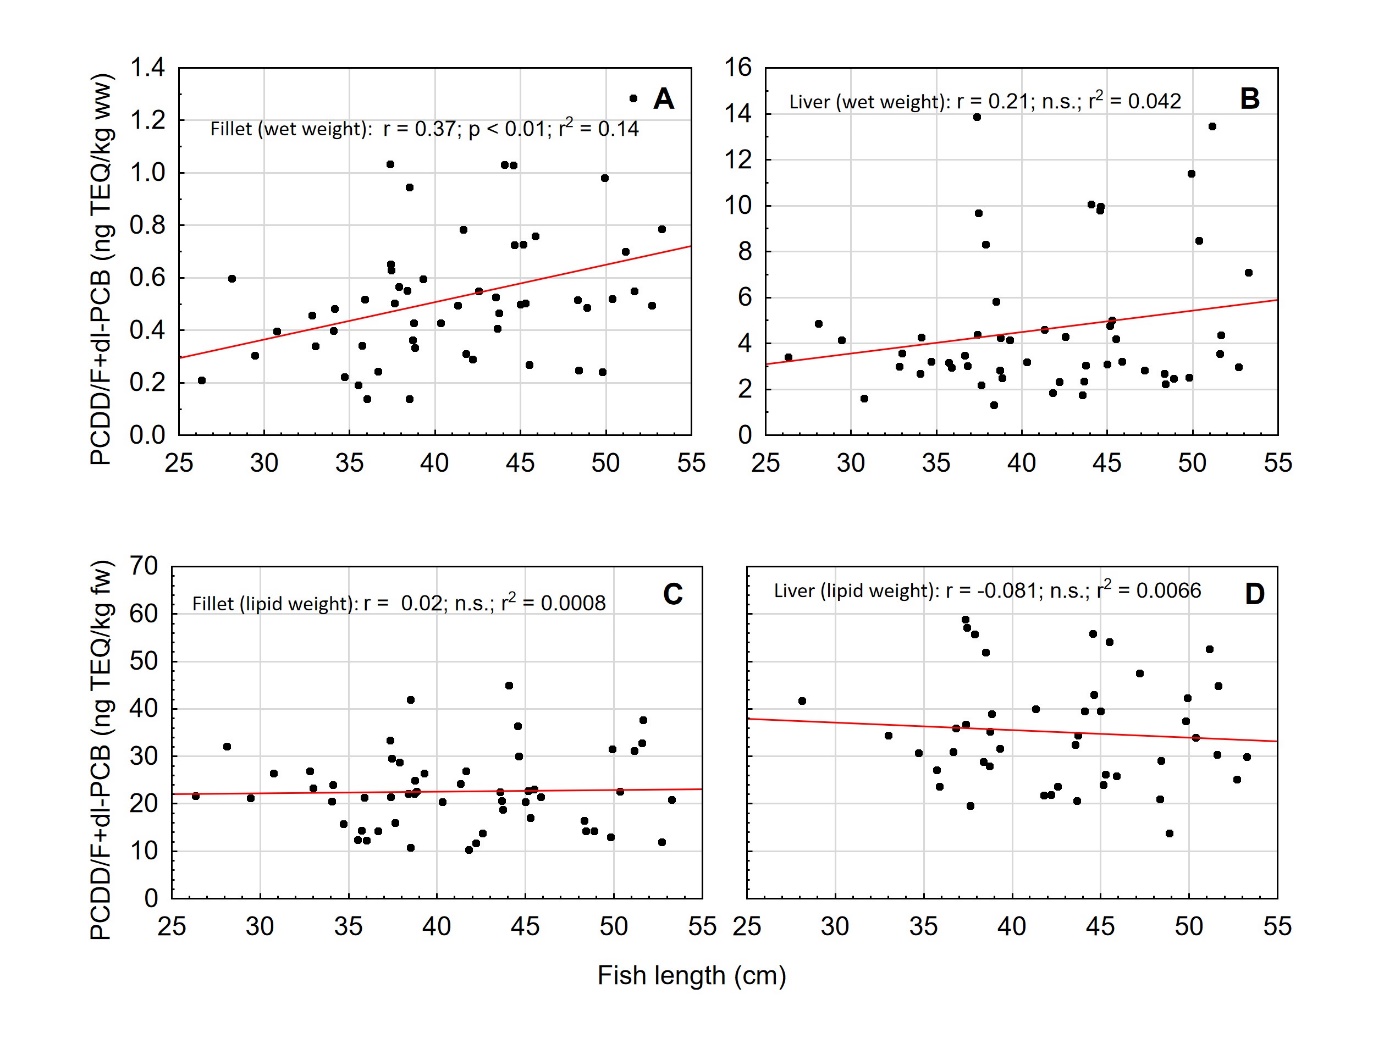
15 . Dioxins and dioxin-like PCBs in plaice
( Pleuronectes
platessa ). Correlation between
fish length (cm) and concentration of sum dioxins and dioxin-like
PCBs (PCDD/F+dl-PCB, ng TEQ/kg). Correlations are given for A) fillet
on wet weight basis (ww), B) Liver on wet weight basis (ww), C)
Fillet on lipid weight basis (fw) and D) Liver on lipid weight basis
(fw). Results of Pearson’s linear correlation are given with
significance level at p<0.05. Notice that A and B have different
scales on the y-axis, while C and D have the same scale. One liver
sample (outlier) with very high concentration of PCDD/F + dl-PCB was
excluded from the graph and analysis.