Figure
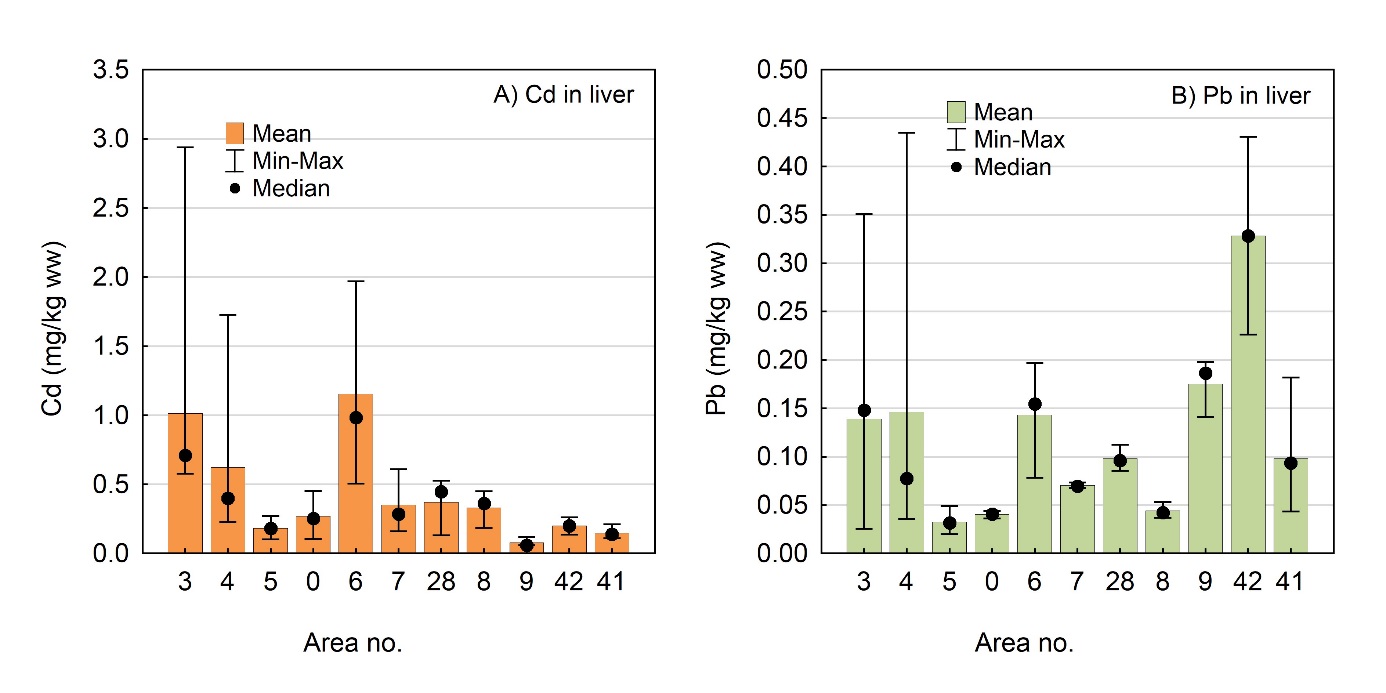
7 Variation in A) Cd concentration (mg/kg
wet weight) and B) Pb concentration (mg/kg wet weight) in liver of
plaice ( Pleuronectes
platessa ) sampled in different
areas along the Norwegian coast (from north to south: areas 03 to 09)
and the North Sea (areas 41 and 42). Mean, minimum, maximum
and median values are shown.