Figure
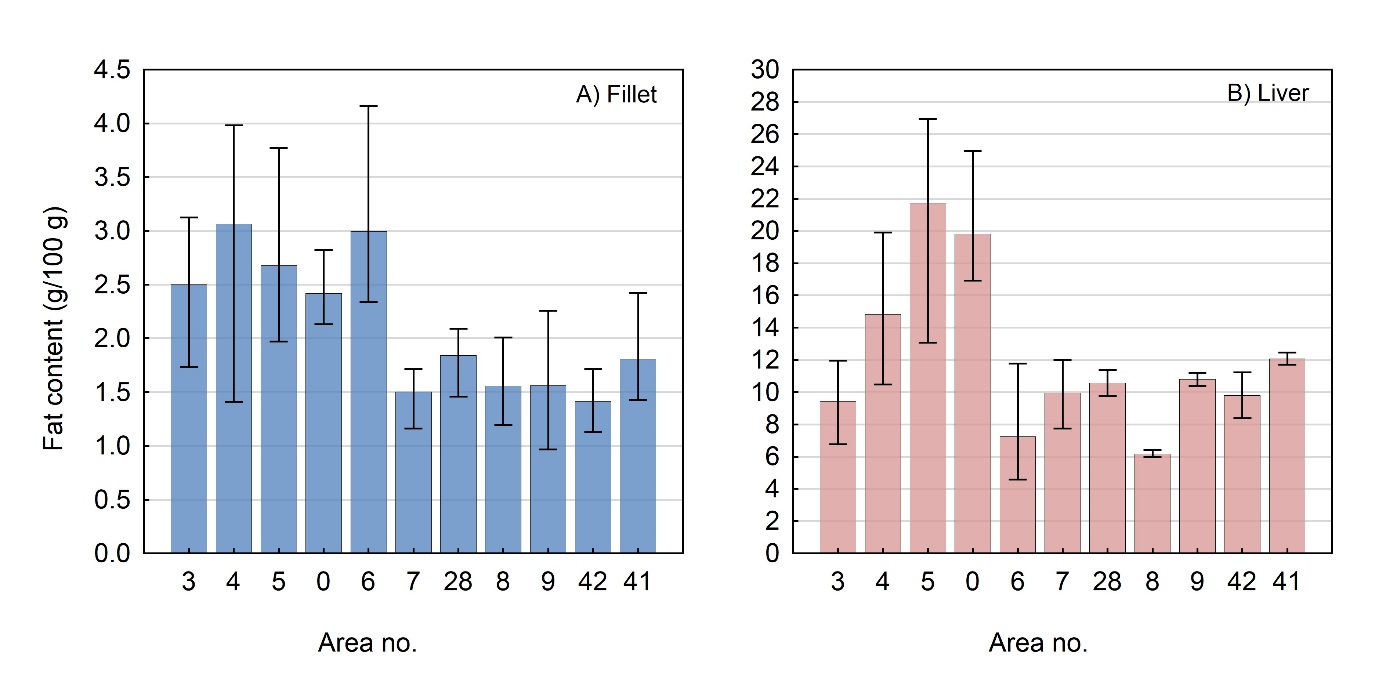
5 Fat contents (g/100 g) in A) fillet and
B) liver of plaice ( Pleuronectes
platessa ) sampled in different
areas (statistics areas) of the Norwegian coast (from north to south:
areas 03 to 09) and the North Sea (areas 41 and 42). Mean,
minimum and maximum values are given.