Figure
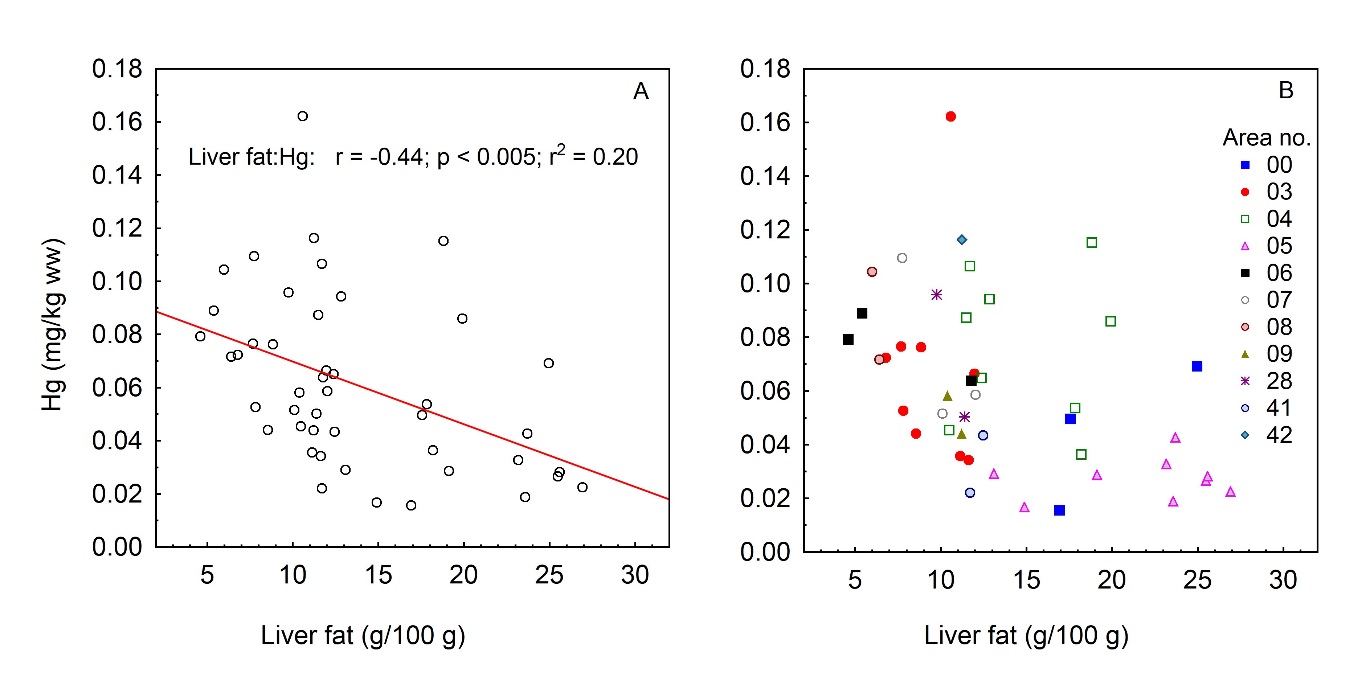
10 Scatterplots mean Hg concentration (mg/kg wet weight) in fillet of
plaice ( Pleuronectes
platessa ) versus fat content in
composite samples of liver (g/100g). A) The whole dataset, giving the
result of linear correlation between Hg and fish length. B)
Categorised by statistics area, where different colours mark
different areas as shown.